Ann Clin Microbiol 2020;23:81-92. Epidemiological Study of an Outbreak of KPC-2-producing Klebsiella pneumoniae in a Tertiary Hospital in Korea
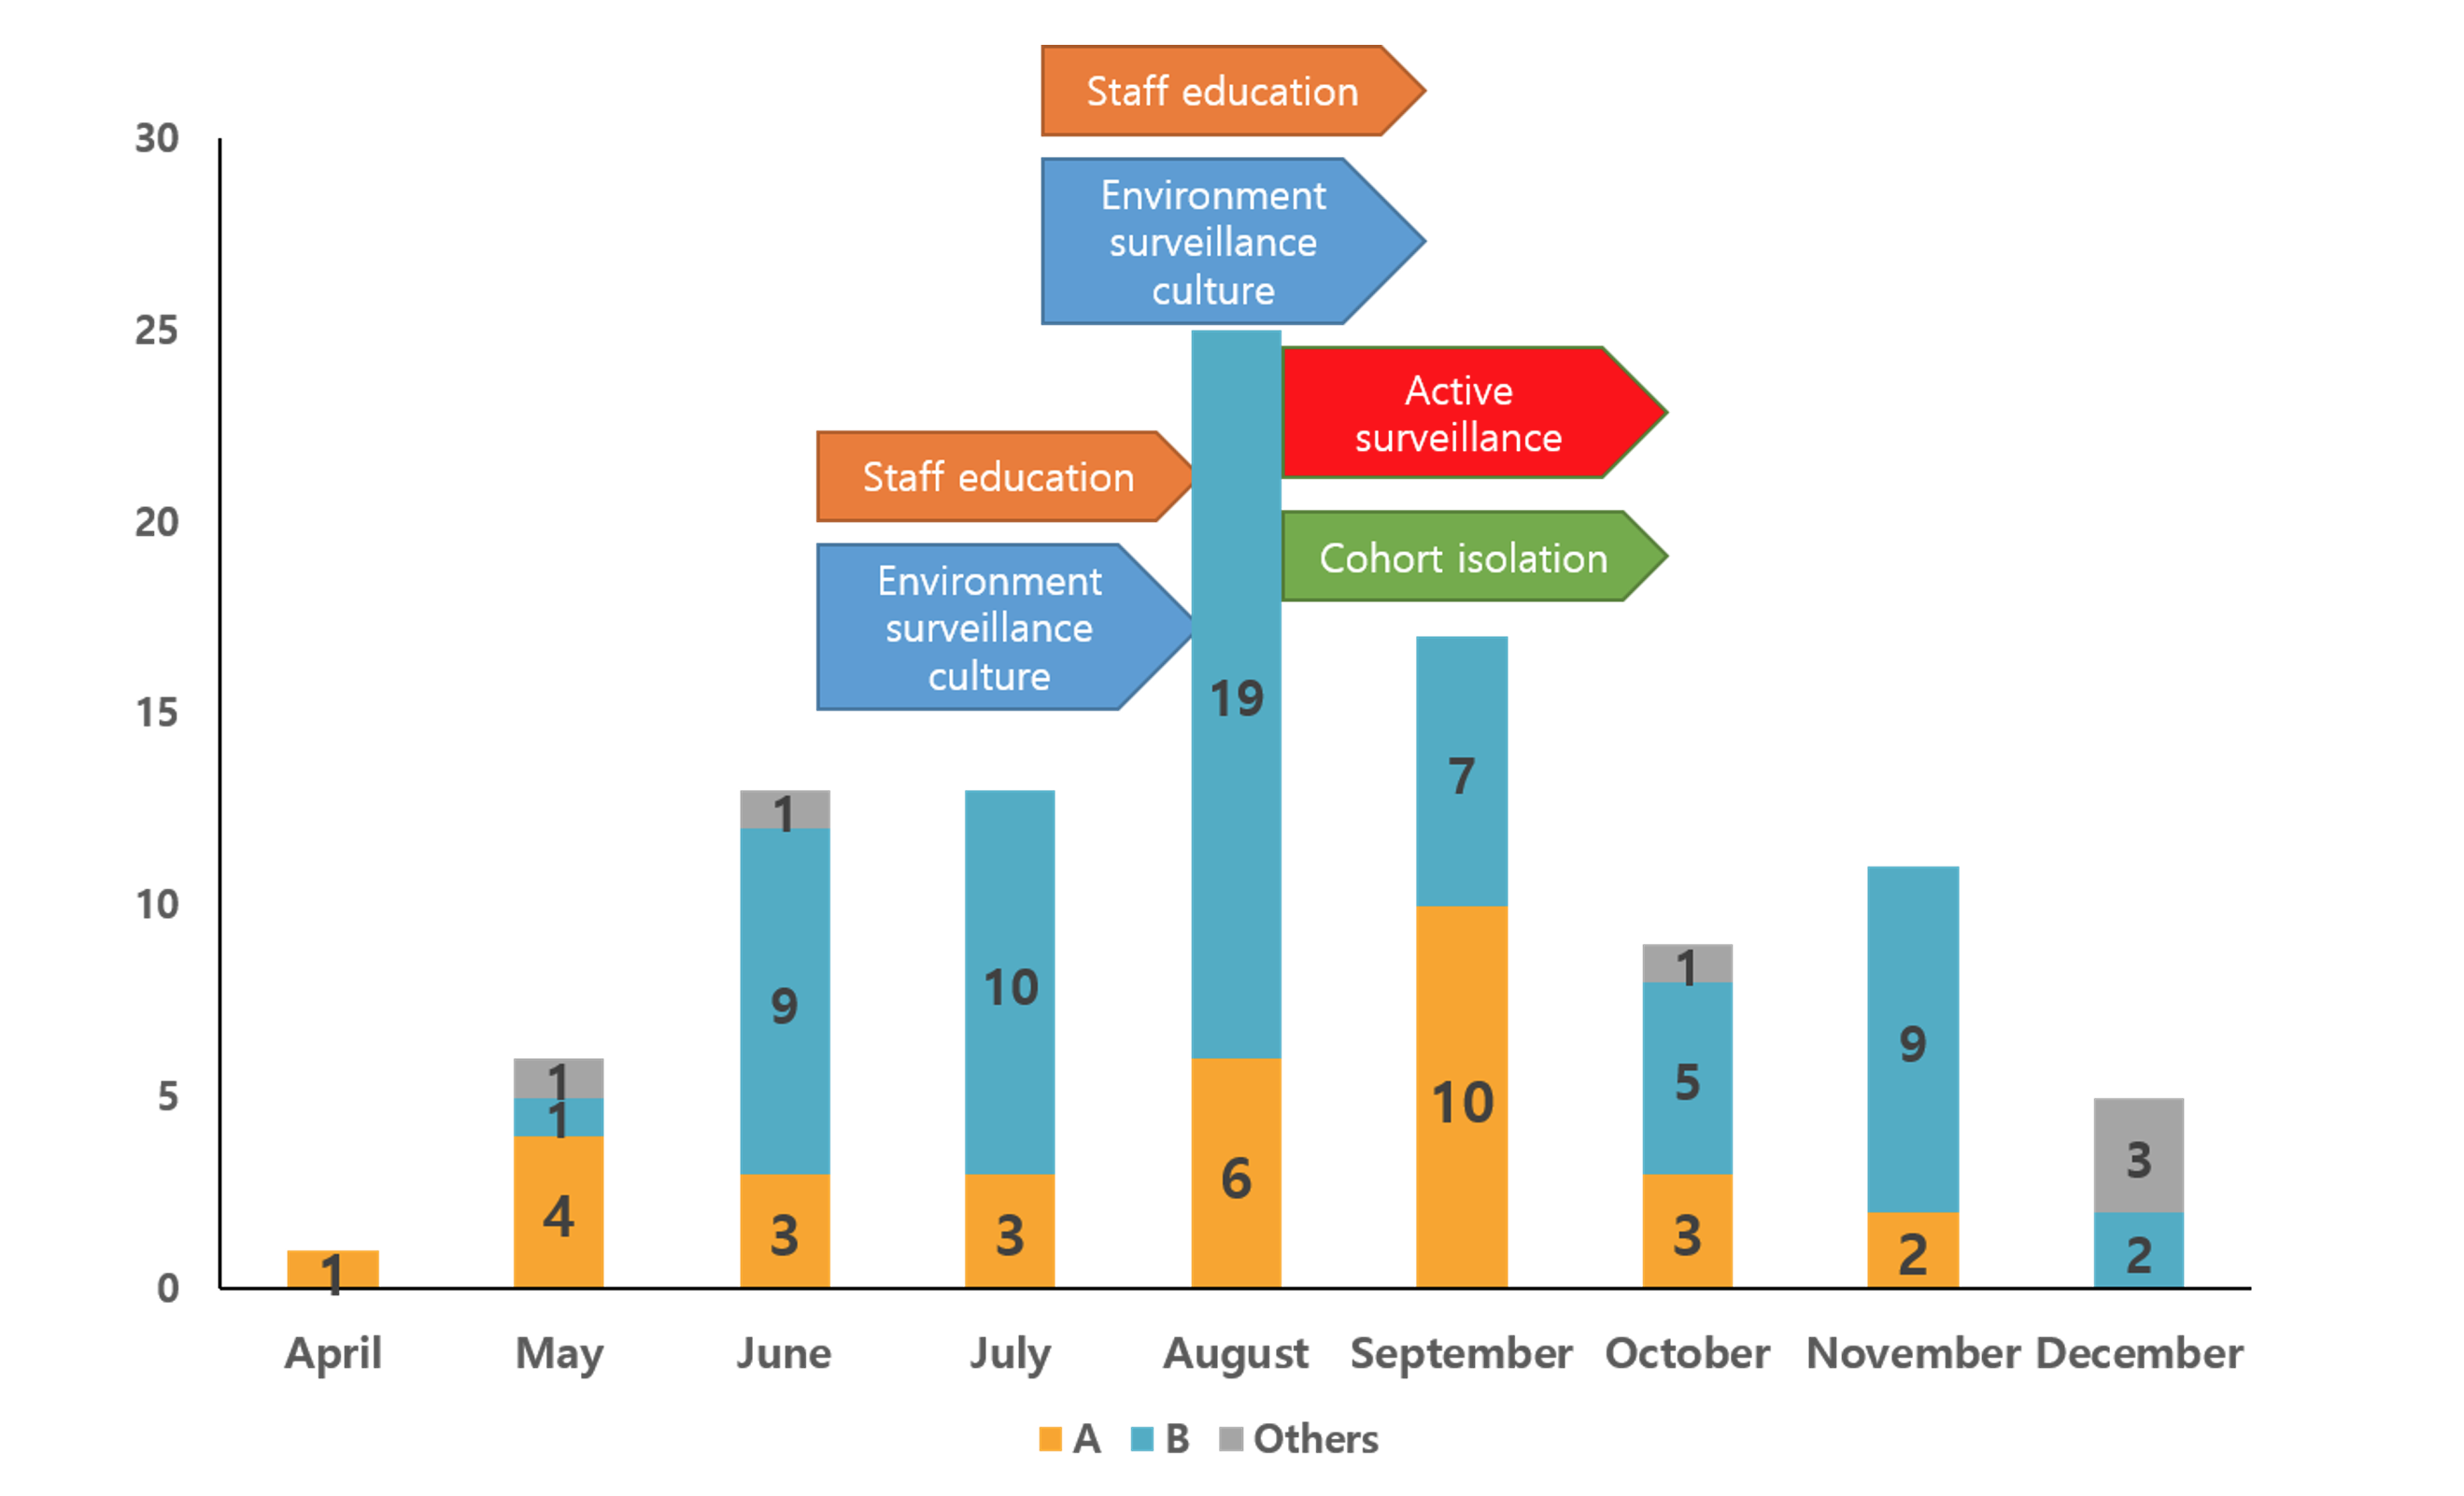
Fig. 1. Monthly isolation of KPC-2 producing K. pneumoniae isolates stratified by PFGE banding patterns. Bar graphs indicate the numbers of KPC-2 producing K. pneumoniae isolates collected in each nine month in 2018 and arrows indicate the activity performed for eradicating a KPC-type carbapenemase producing K. pneumoniae isolates outbreak. Yellow bar, pulsotype A; Blue bar, pulsotype B; Gray bar, other pulsotypes.
