Ann Clin Microbiol 2021;24:61-65. First Report of Roseomonas aerofrigidensis Isolated from the Peritoneal Fluid of a Gastric Cancer Patient
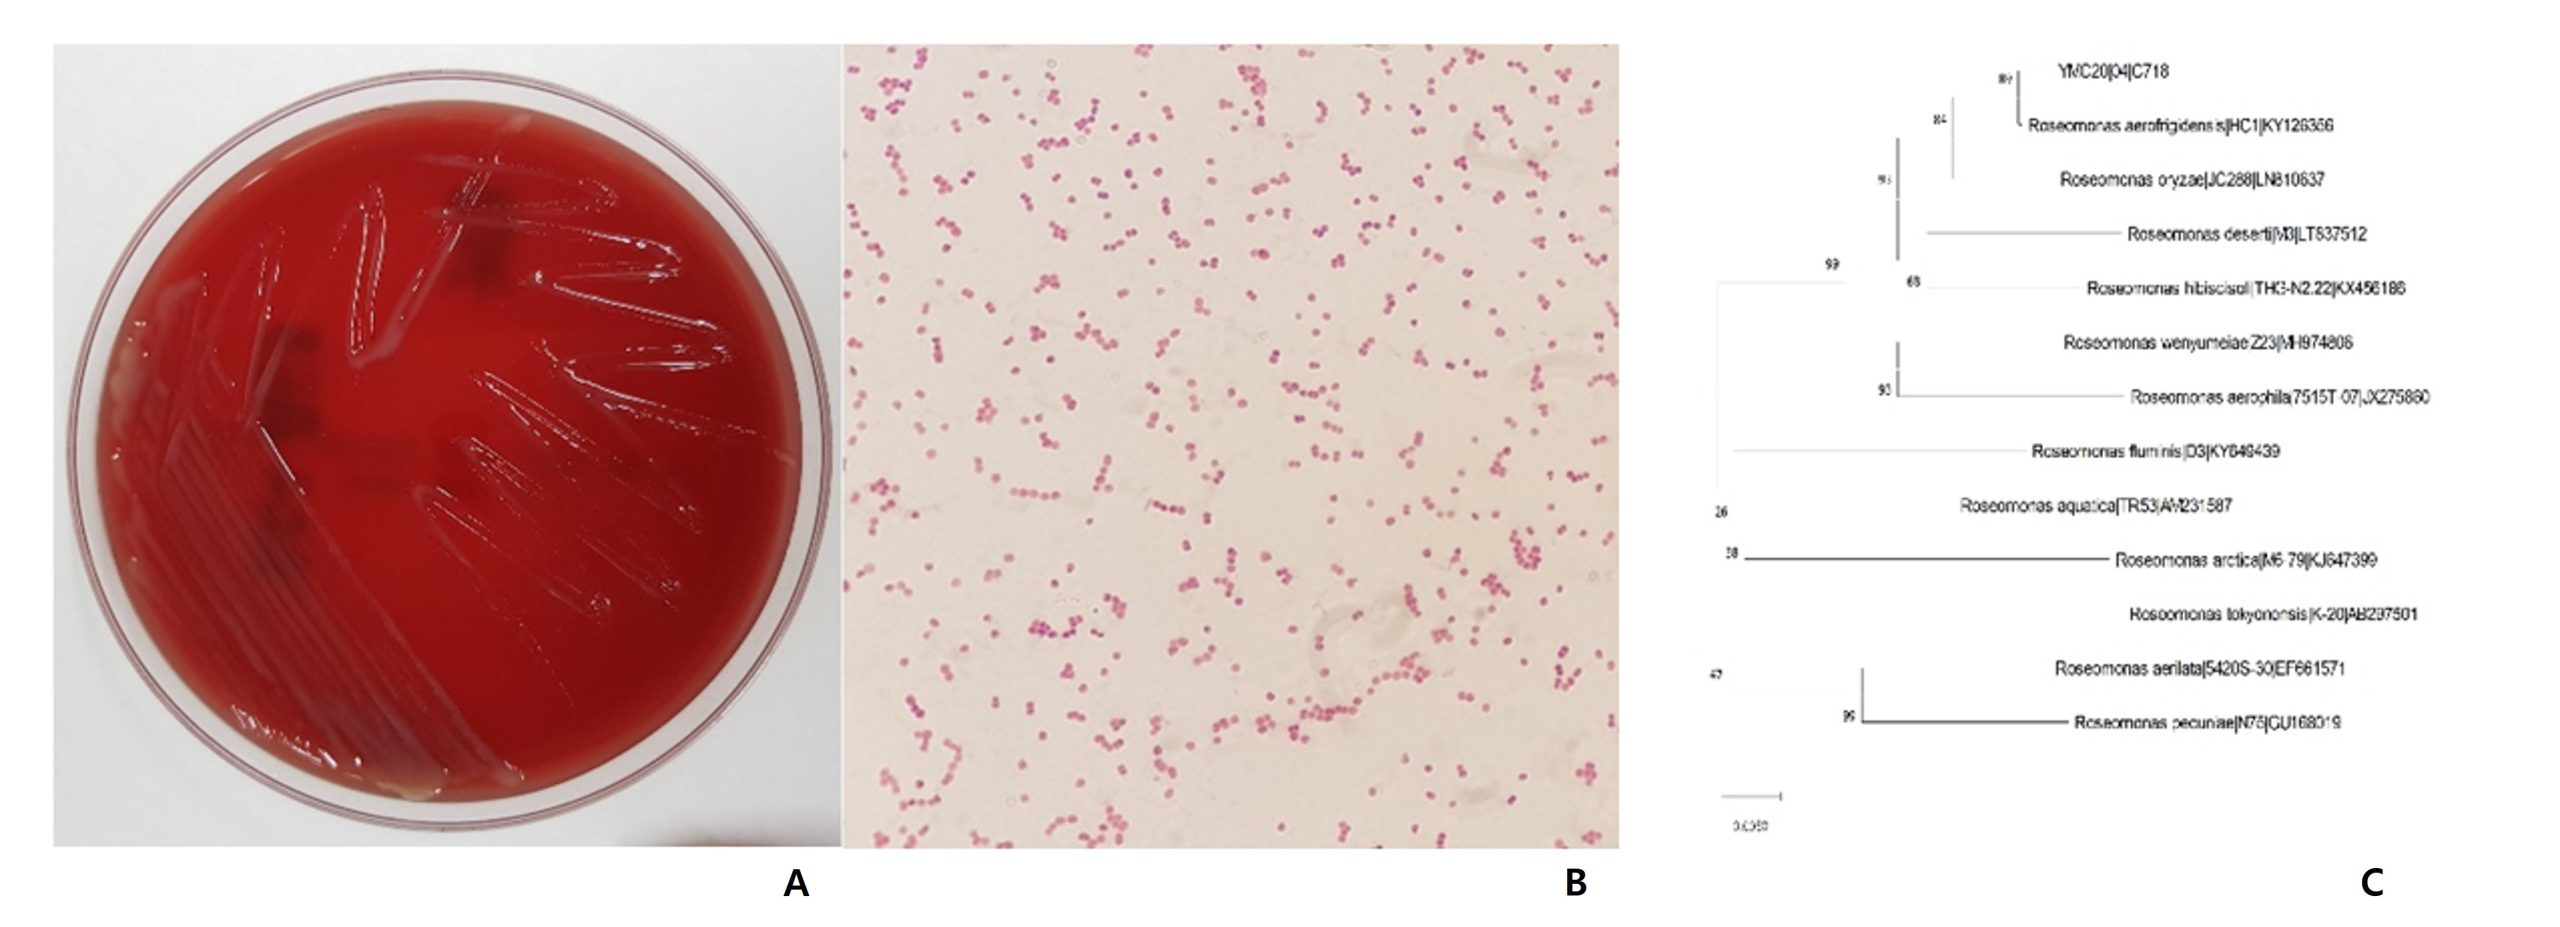
Fig. 1. Colony morphology, microscopic image and genetic relationship with related taxa of R. aerofrigidensis. (A) Colonies on sheep blood agar. (B) Gram staining of the isolate (1,000×). (C) A neighbor-joining tree based on 16S rRNA gene sequences. The scale bar equals 0.0050 changes per nucleotide position. Bootstrap values are shown on nodes as percentages of 1,000 replicates.
