Ann Clin Microbiol 2022;25:73-78. On-field evaluation of exdia COVID-19 antigen point-of-care testing in the emergency department during the COVID-19 pandemic
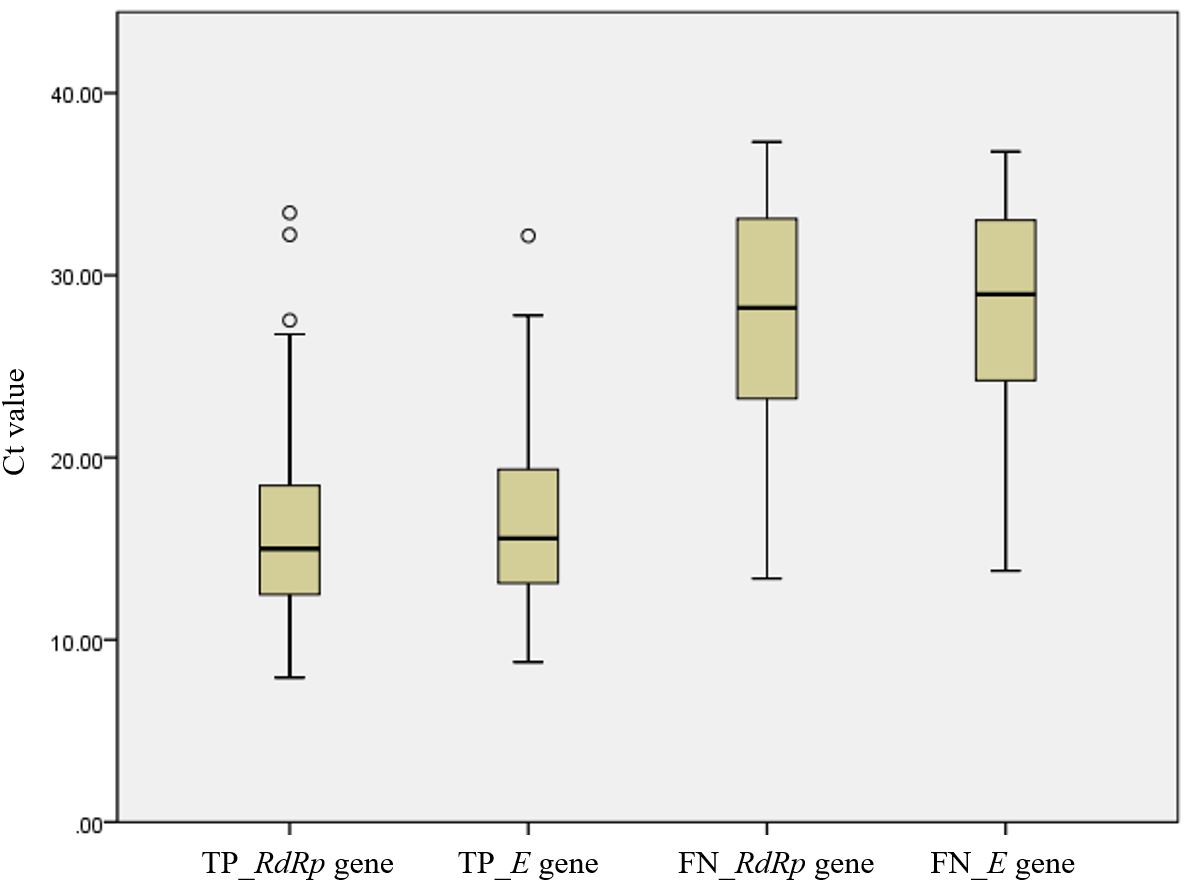
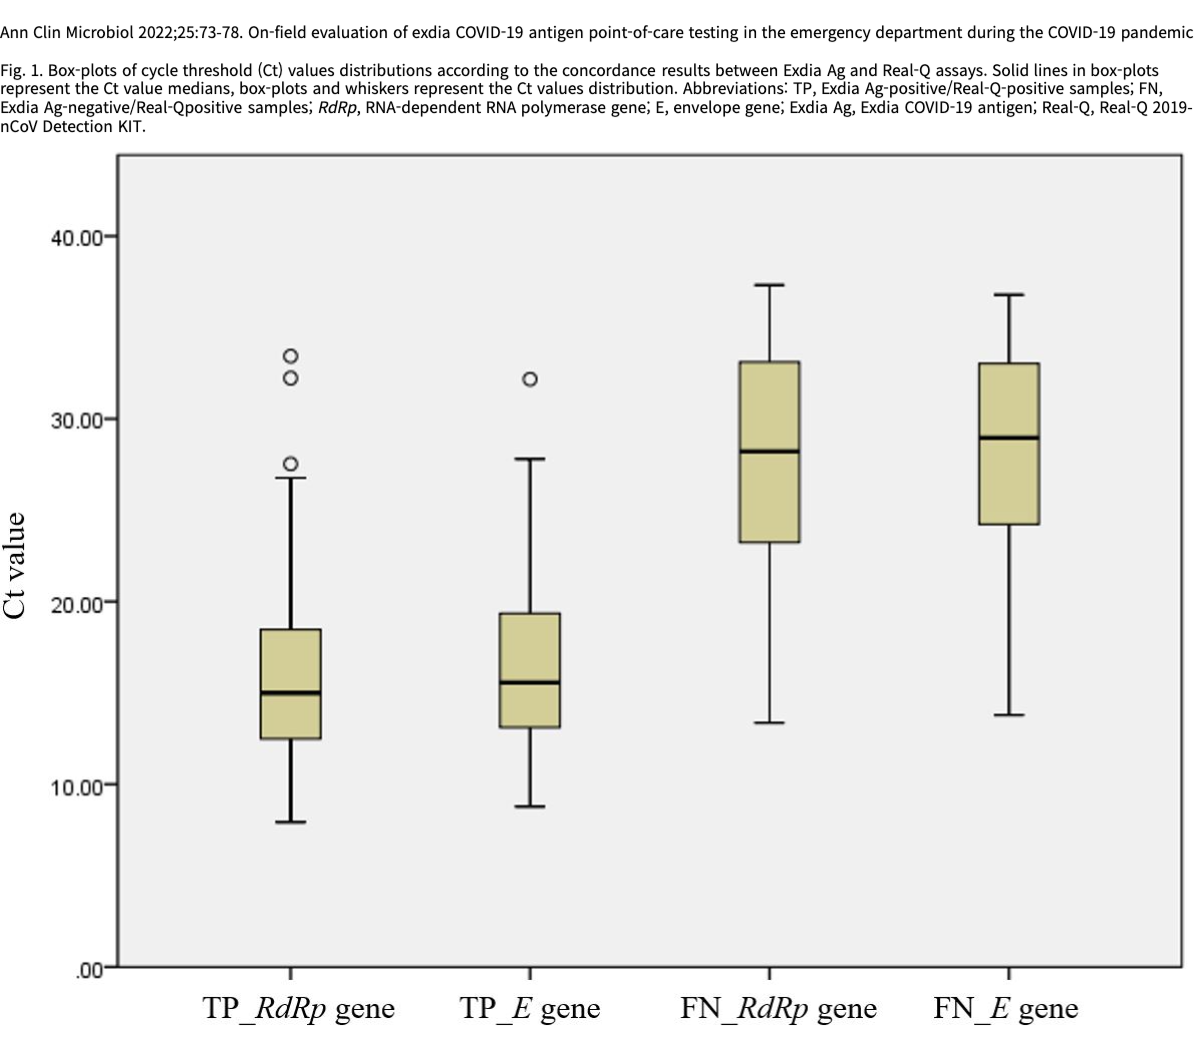
Fig. 1. Box-plots of cycle threshold (Ct) values distributions according to the concordance results between Exdia Ag and Real-Q assays. Solid lines in box-plots represent the Ct value medians, box-plots and whiskers represent the Ct values distribution. Abbreviations: TP, Exdia Ag-positive/Real-Q-positive samples; FN, Exdia Ag-negative/Real-Qpositive samples; RdRp, RNA-dependent RNA polymerase gene; E, envelope gene; Exdia Ag, Exdia COVID-19 antigen; Real-Q, Real-Q 2019-nCoV Detection KIT.