Ann Clin Microbiol 2025;28(1):3. Mock communities to assess biases in next-generation sequencing of bacterial species representation
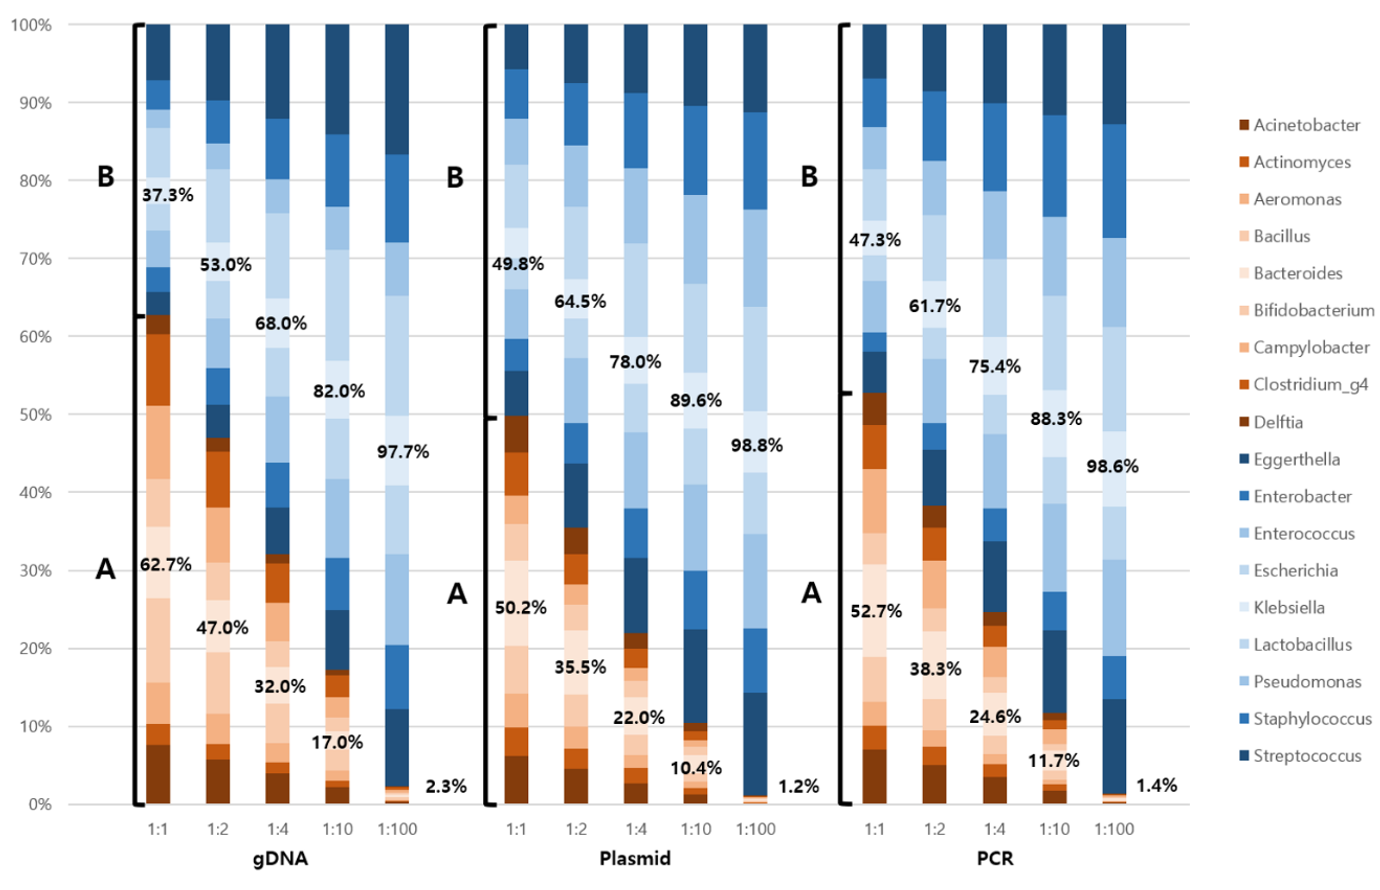
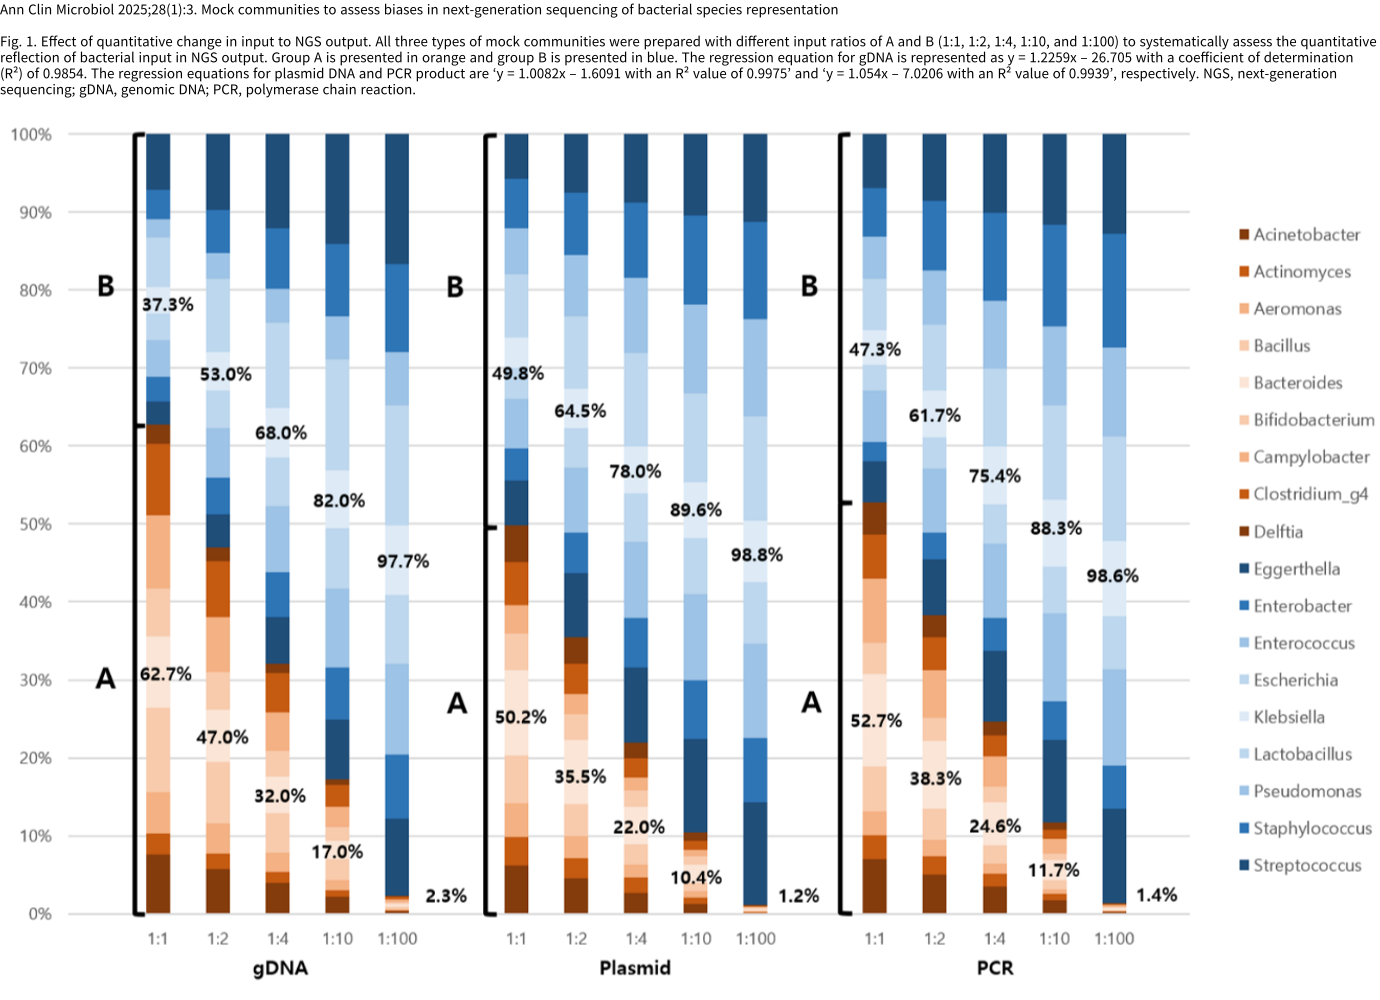
Fig. 1. Effect of quantitative change in input to NGS output. All three types of mock communities were prepared with different input ratios of A and B (1:1, 1:2, 1:4, 1:10, and 1:100) to systematically assess the quantitative reflection of bacterial input in NGS output. Group A is presented in orange and group B is presented in blue. The regression equation for gDNA is represented as y = 1.2259x – 26.705 with a coefficient of determination (R²) of 0.9854. The regression equations for plasmid DNA and PCR product are ‘y = 1.0082x – 1.6091 with an R² value of 0.9975’ and ‘y = 1.054x – 7.0206 with an R² value of 0.9939’, respectively. NGS, next-generation sequencing; gDNA, genomic DNA; PCR, polymerase chain reaction.