
Abstract
Background: Clostridioides (Clostridium) difficile is an important pathogen that causes diarrhea in people who take antibiotics. The recent status of C. difficile infection is not well-known in Korea.Methods: The long-term trend of C. difficile infection in Korean hospitals was analyzed using a nationwide sample cohort. The data also included sociodemographic characteristics, disease severity, and healthcare facilities. C. difficile infection was defined by the prescription of oral vancomycin or all metronidazole prescriptions under C. difficile infectious disease code (A047).Results: The rate of C. difficile infection has steadily increased from 0.030% in 2006 to 0.317% in 2015. The increased rate correlated to age (0.033% for <50 years, 0.421% for 70-79 years, and 0.758% for >80 years of age) and the Charlson comorbidity index score (0.048% for zero versus 0.378% for three or more points). It differed by the type of medical institution (0.270 % at referral hospitals versus 0.056 % at general hospitals and mental hospitals).Conclusion: The rate of C. difficile infection in Korea is significant in patients with advanced age and disease severity. The results show that C. difficile infection trend has been increasing steadily in Korea.
Keywords
Clostridioides difficile, Cohort studies, Infections, Rate, Trend
Figures & Tables
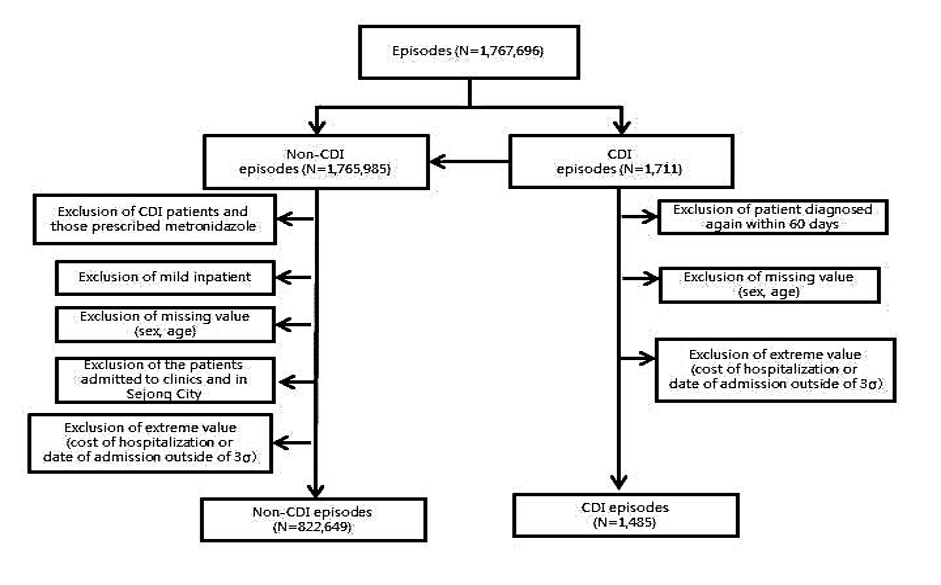
Fig. 1. Data construction flow diagram. CDI, C. difficile infection.
Figures & Tables
Table 1. The number and rates of
| Characteristic | Cases (Infection rate) No. (%) | |||||||||||
| Year | 2006 | 2007 | 2008 | 2009 | 2010 | 2011 | 2012 | 2013 | 2014 | 2015 | Total | P-value* |
| Sex | ||||||||||||
| Male | 9 (0.034) | 22 (0.070) | 27 (0.080) | 42 (0.116) | 55 (0.140) | 63 (0.150) | 118 (0.267) | 100 (0.226) | 117 (0.255) | 143 (0.301) | 696 (0.178) | <.0001 |
| Female | 8 (0.027) | 18 (0.052) | 30 (0.080) | 53 (0.133) | 82 (0.186) | 83 (0.179) | 92 (0.186) | 132 (0.267) | 119 (0.236) | 172 (0.331) | 789 (0.182) | <.0001 |
| Age (yr) | ||||||||||||
| 0-49 | 1 (0.003) | 4 (0.012) | 7 (0.020) | 11 (0.030) | 13 (0.032) | 16 (0.039) | 21 (0.050) | 14 (0.034) | 13 (0.031) | 25 (0.059) | 125 (0.033) | 0.0015 |
| 50-59 | 2 (0.025) | 4 (0.043) | 10 (0.093) | 9 (0.075) | 11 (0.079) | 10 (0.063) | 35 (0.204) | 20 (0.114) | 28 (0.156) | 30 (0.165) | 159 (0.113) | 0.0049 |
| 60-69 | 4 (0.049) | 10 (0.099) | 14 (0.131) | 12 (0.106) | 35 (0.287) | 36 (0.283) | 35 (0.252) | 36 (0.257) | 42 (0.287) | 46 (0.296) | 270 (0.219) | 0.0009 |
| 70-79 | 7 (0.102) | 9 (0.097) | 19 (0.191) | 32 (0.299) | 40 (0.345) | 44 (0.352) | 76 (0.550) | 77 (0.552) | 76 (0.533) | 104 (0.708) | 484 (0.412) | <.0001 |
| < 80 | 3 (0.113) | 13 (0.300) | 7 (0.149) | 31 (0.615) | 38 (0.673) | 40 (0.663) | 43 (0.612) | 85 (1.185) | 77 (0.993) | 110 (1.272) | 447 (0.758) | <.0001 |
| Insurance ranking | ||||||||||||
| Medical benefits | 3 (0.045) | 6 (0.075) | 10 (0.124) | 20 (0.236) | 20 (0.242) | 20 (0.241) | 36 (0.425) | 38 (0.477) | 28 (0.340) | 52 (0.647) | 233 (0.289) | 0.0001 |
| 1, 2 | 1 (0.014) | 4 (0.050) | 7 (0.085) | 12 (0.13) | 17 (0.167) | 18 (0.160) | 26 (0.215) | 29 (0.225) | 30 (0.228) | 28 (0.195) | 172 (0.162) | 0.0001 |
| 3, 4 | 3 (0.038) | 1 (0.013) | 7 (0.076) | 7 (0.070) | 23 (0.204) | 12 (0.103) | 23 (0.179) | 27 (0.221) | 24 (0.193) | 32 (0.262) | 159 (0.148) | 0.0004 |
| 5, 6 | 2 (0.022) | 11 (0.095) | 5 (0.041) | 13 (0.100) | 19 (0.133) | 18 (0.119) | 27 (0.169) | 18 (0.112) | 31 (0.186) | 45 (0.264) | 189 (0.134) | 0.0008 |
| 7, 8 | 4 (0.033) | 8 (0.056) | 10 (0.065) | 17 (0.103) | 20 (0.108) | 31 (0.161) | 44 (0.216) | 60 (0.291) | 53 (0.247) | 49 (0.222) | 296 (0.164) | <.0001 |
| 9, 10 | 4 (0.030) | 10 (0.061) | 18 (0.101) | 26 (0.137) | 38 (0.182) | 47 (0.208) | 54 (0.225) | 60 (0.251) | 70 (0.288) | 109 (0.423) | 436 (0.210) | <.0001 |