
Abstract
Background: Blood culture is essential for diagnosis of sepsis. However, usually the available blood volume is not sufficient to meet the guidelines. Thus, periodic monitoring and feedback are essential to improve the quality of blood cultures.Methods: We analyzed blood cultures requested between November 2018 and June 2019, and provided educational intervention and coaching for phlebotomists at the end of February 2019. Then, we evaluated the impact of education on blood cultures in a secondary‑care hospital. Blood volume, positive rate, contamination rate, and time to detection (TTD) were compared between the pre- (November 2018 to February, 2019) and post-intervention periods (March to June, 2019).Results: The average blood volume increased significantly from 5.4 mL to 7.1 mL (P < 0.0001) (35.2%) after intervention. Accordingly, the proportion of optimal blood volume (8–12 mL) increased from 9.1% to 37.8% (P < 0.0001). Before the intervention, the positivity rate was 9.6% and the contamination rate was 0.5%, whereas after the intervention, the positivity rate decreased to 9.1% and the contamination rate increased to 1.1%. TTD improved from 14.7 hours to 13.1 hours (P = 0.0420).Conclusion: The educational intervention of the phlebotomy team improved the quality of blood cultures, especially blood volumes and TTD. However, the positivity rate did not increase, suggesting that it is affected not only by the blood volumes but also by the severity of the underlying illnesses of the patient in a secondary-care hospital.
Keywords
Bacteremia Blood culture Blood volume Educational intervention Quality improvement
Figures & Tables
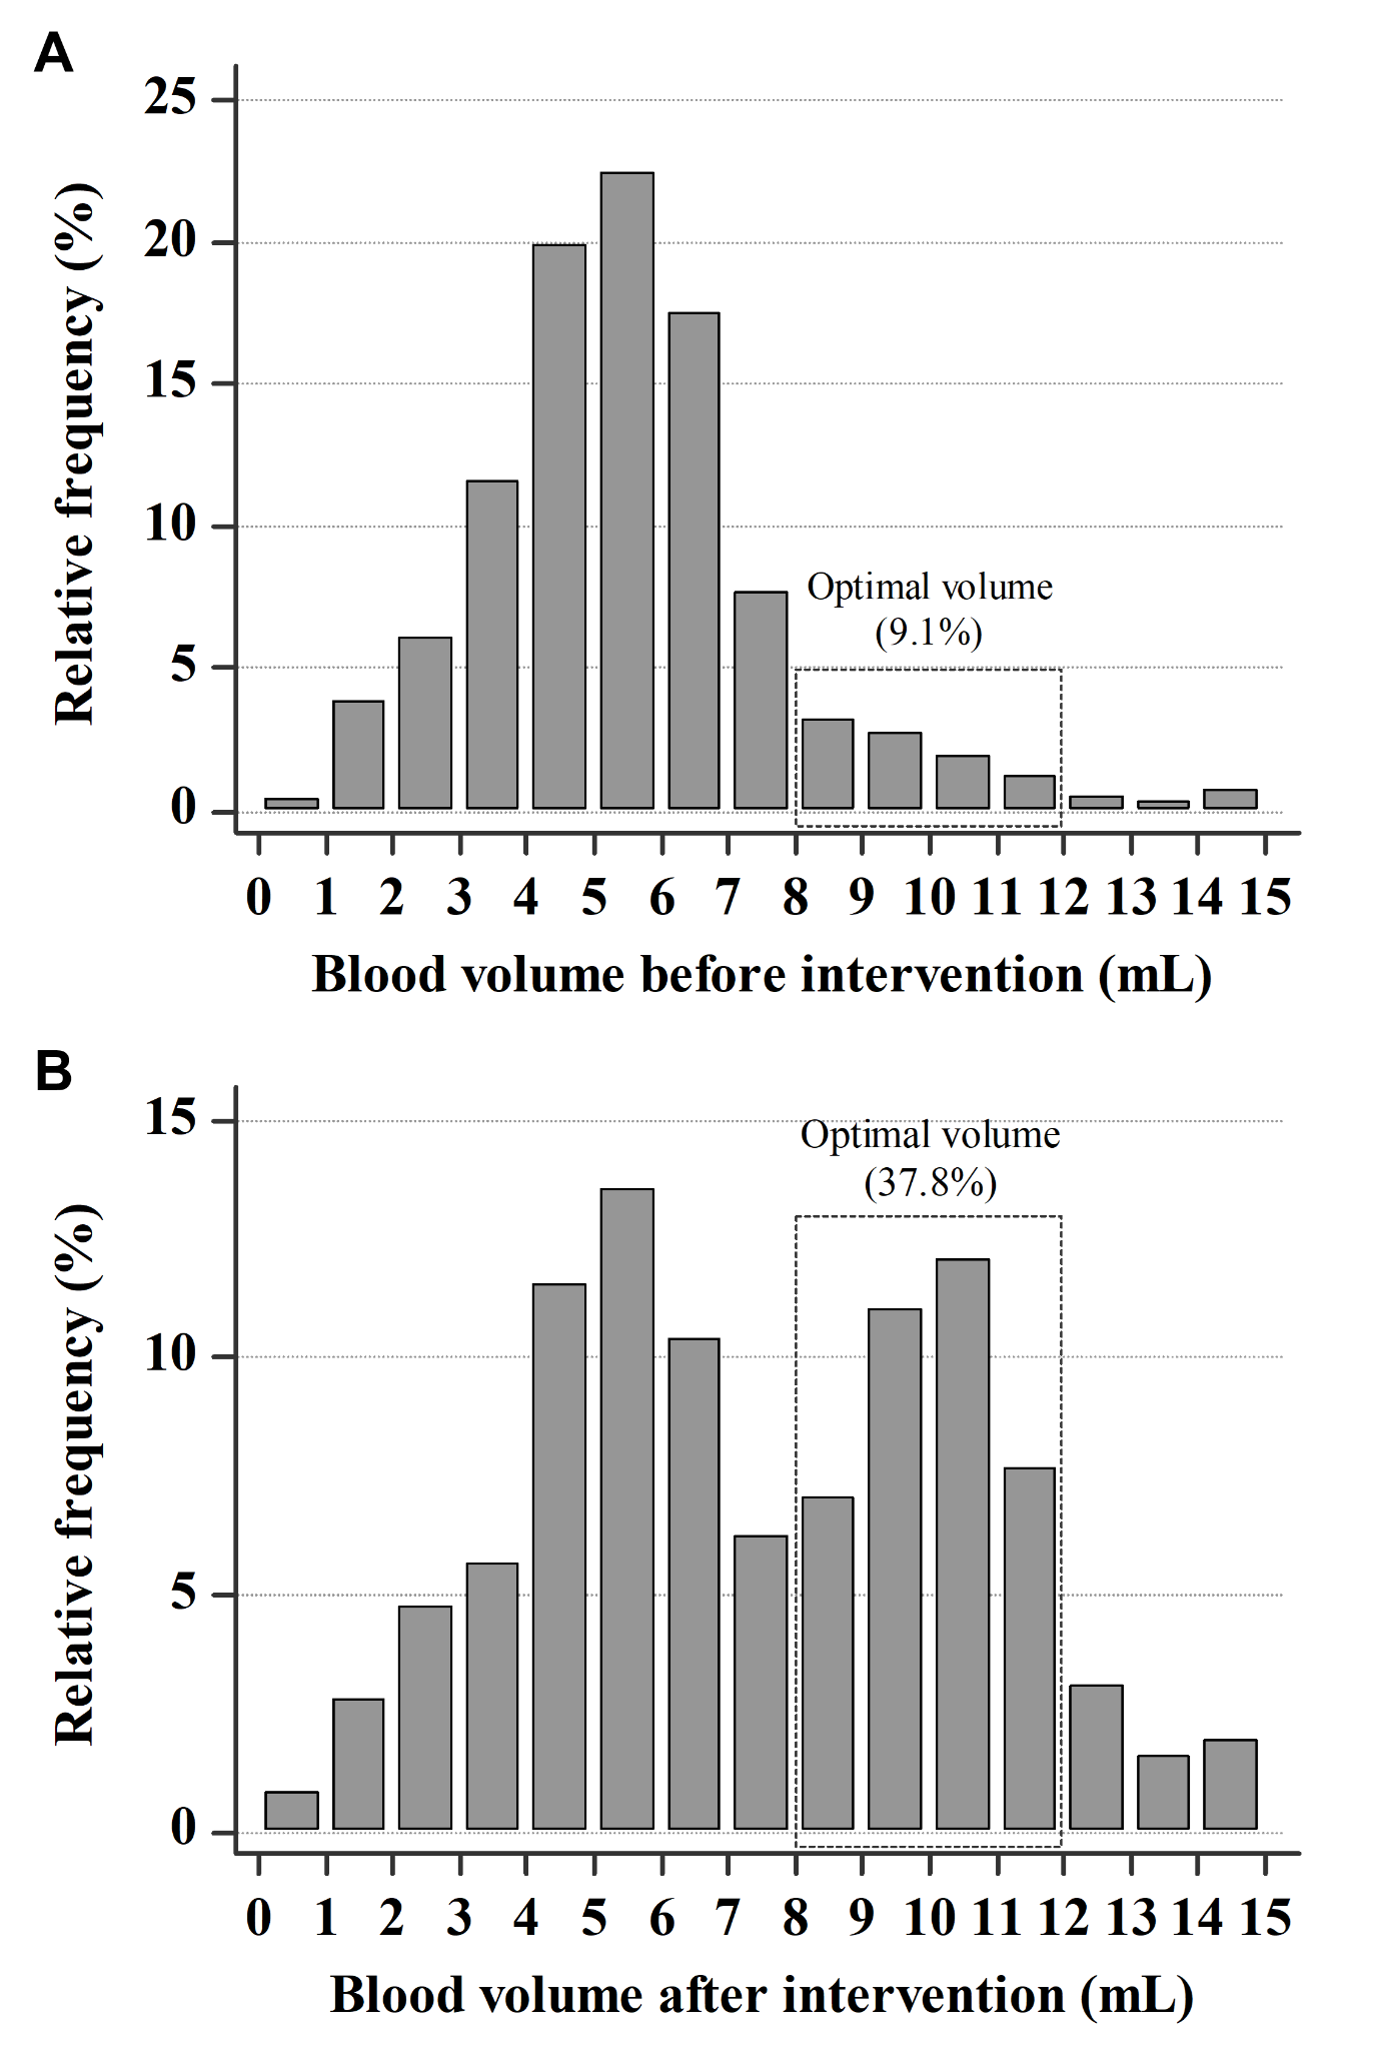
Fig. 1. Distribution of blood volume in blood culture bottles. The optimal volume (8–12 mL) accounted for (A) 9.1% in pre-interventional period and (B) 37.8% in post-interventional period.
Figures & Tables
Table 1. Comparison of indicators of blood cultures between pre- and post- educational intervention period
| Variable | Pre-intervention (n=9,064 bottles) | Post-intervention (n=9,154 bottles) | P-value |
| Blood volume per bottle, mL (IQR) | 5.4 (4.1 – 6.5) | 7.1 (5.0 – 10.1) | <0.0001 |
| Blood volume per aerobic bottle, mL (IQR) | 5.3 (4.1 – 6.4) | 7.7 (5.4 – 10.2) | <0.0001 |
| Blood volume per anaerobic bottle, mL (IQR) | 5.5 (4.1 – 6.7) | 6.4 (4.7 – 9.9) | <0.0001 |
| Blood volume per bottle by laboratory technicians, mL (IQR) | 6.0 (4.5 – 7.7) | 8.6 (5.4 – 10.5) | <0.0001 |
| Blood volume per bottle by emergency medical technicians, mL (IQR) | 5.1 (4.0 – 6.0) | 6.3 (4.9 – 9.8) | <0.0001 |
| Rate of optimal blood volume, n (%)* | 9.1% (157/1,725) | 37.8% (3,212/8,492) | <0.0001 |
| Positive rate, n | 9.6% (433/4,532) | 9.1% (415/4,577) | 0.4237 |
| Contamination rate, n | 0.5% (24/4,532) | 1.1% (50/4,577) | 0.0028 |
| Time to detection, hr (IQR) | 14.7 (11.1 – 22.6) | 13.2 (10.4 – 22.1) | 0.0420 |
| Time to identification, hr (IQR) | 81.6 (63.0 – 110.9) | 72.2 (63.2 – 102.9) | 0.0183 |