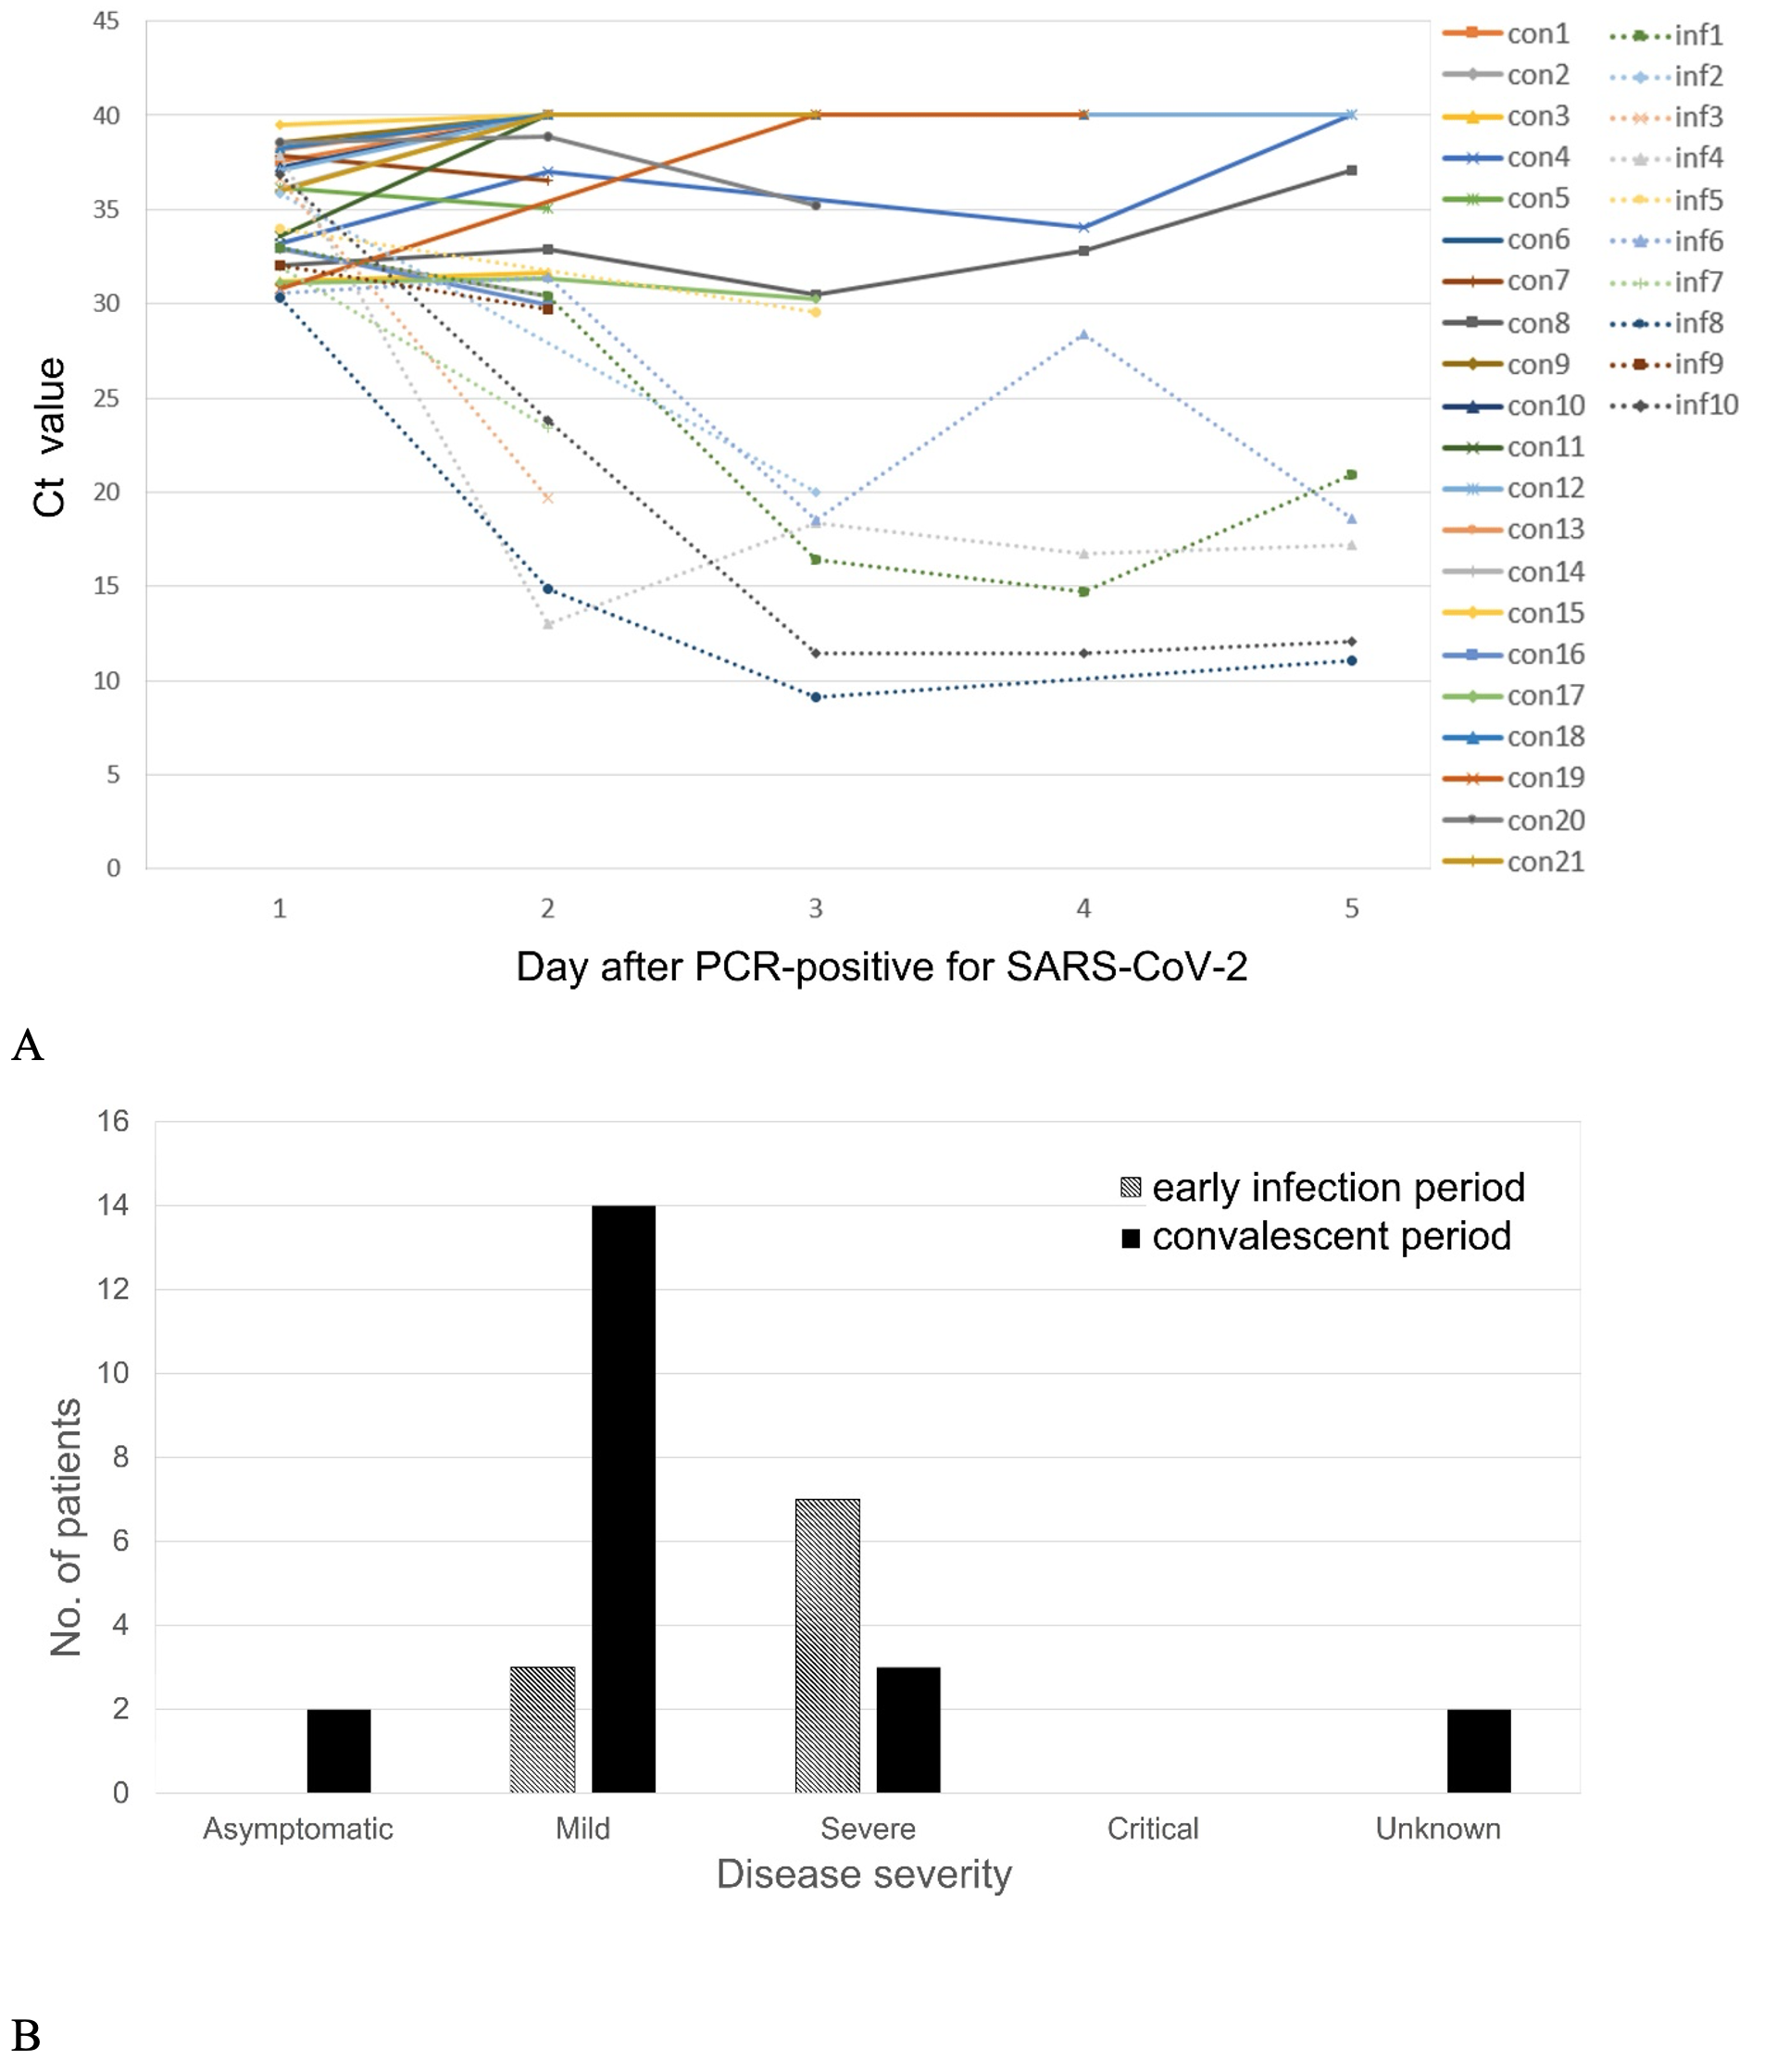
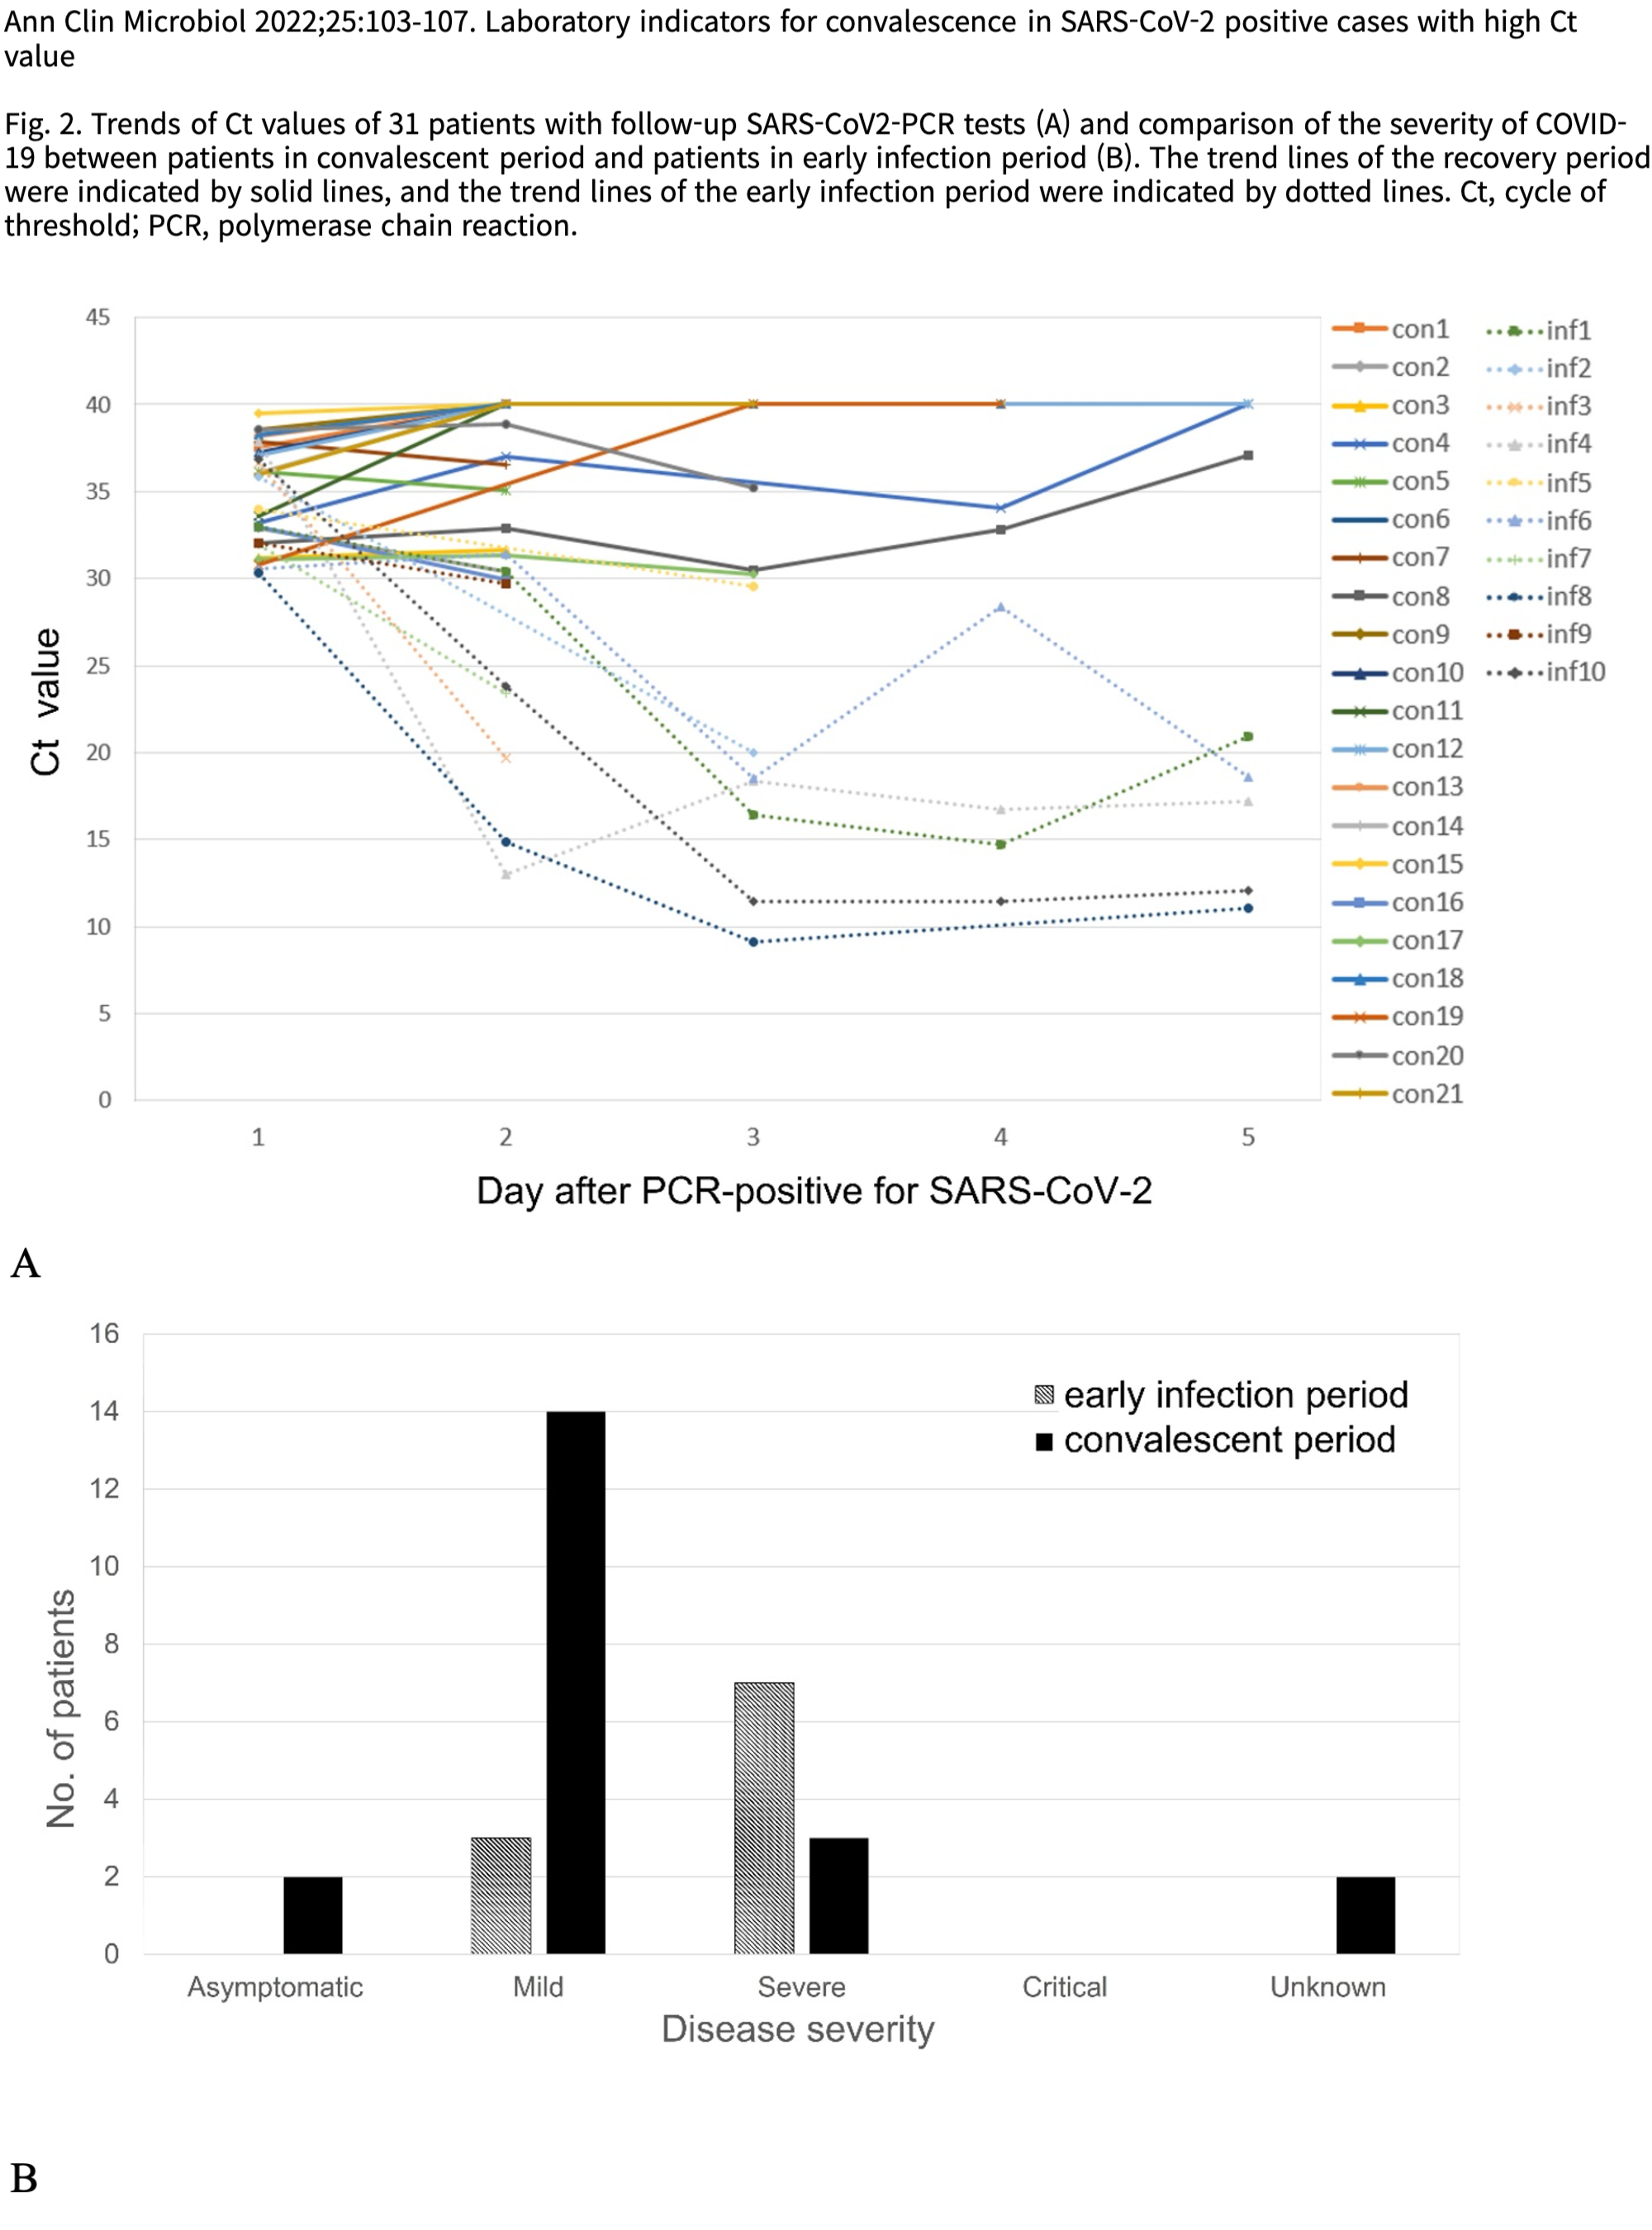
Ann Clin Microbiol 2022;25:103-107. Laboratory indicators for convalescence in SARS-CoV-2 positive cases with high Ct value
Fig. 2. Trends of Ct values of 31 patients with follow-up SARS-CoV2-PCR tests (A) and comparison of the severity of COVID-19 between patients in convalescent period and patients in early infection period (B). The trend lines of the recovery period were indicated by solid lines, and the trend lines of the early infection period were indicated by dotted lines. Ct, cycle of threshold; PCR, polymerase chain reaction.