Ann Clin Microbiol 2026;29(3):12. Evolving molecular epidemiology and antimicrobial resistance of Streptococcus agalactiae in South Korea and East Asia: a narrative review
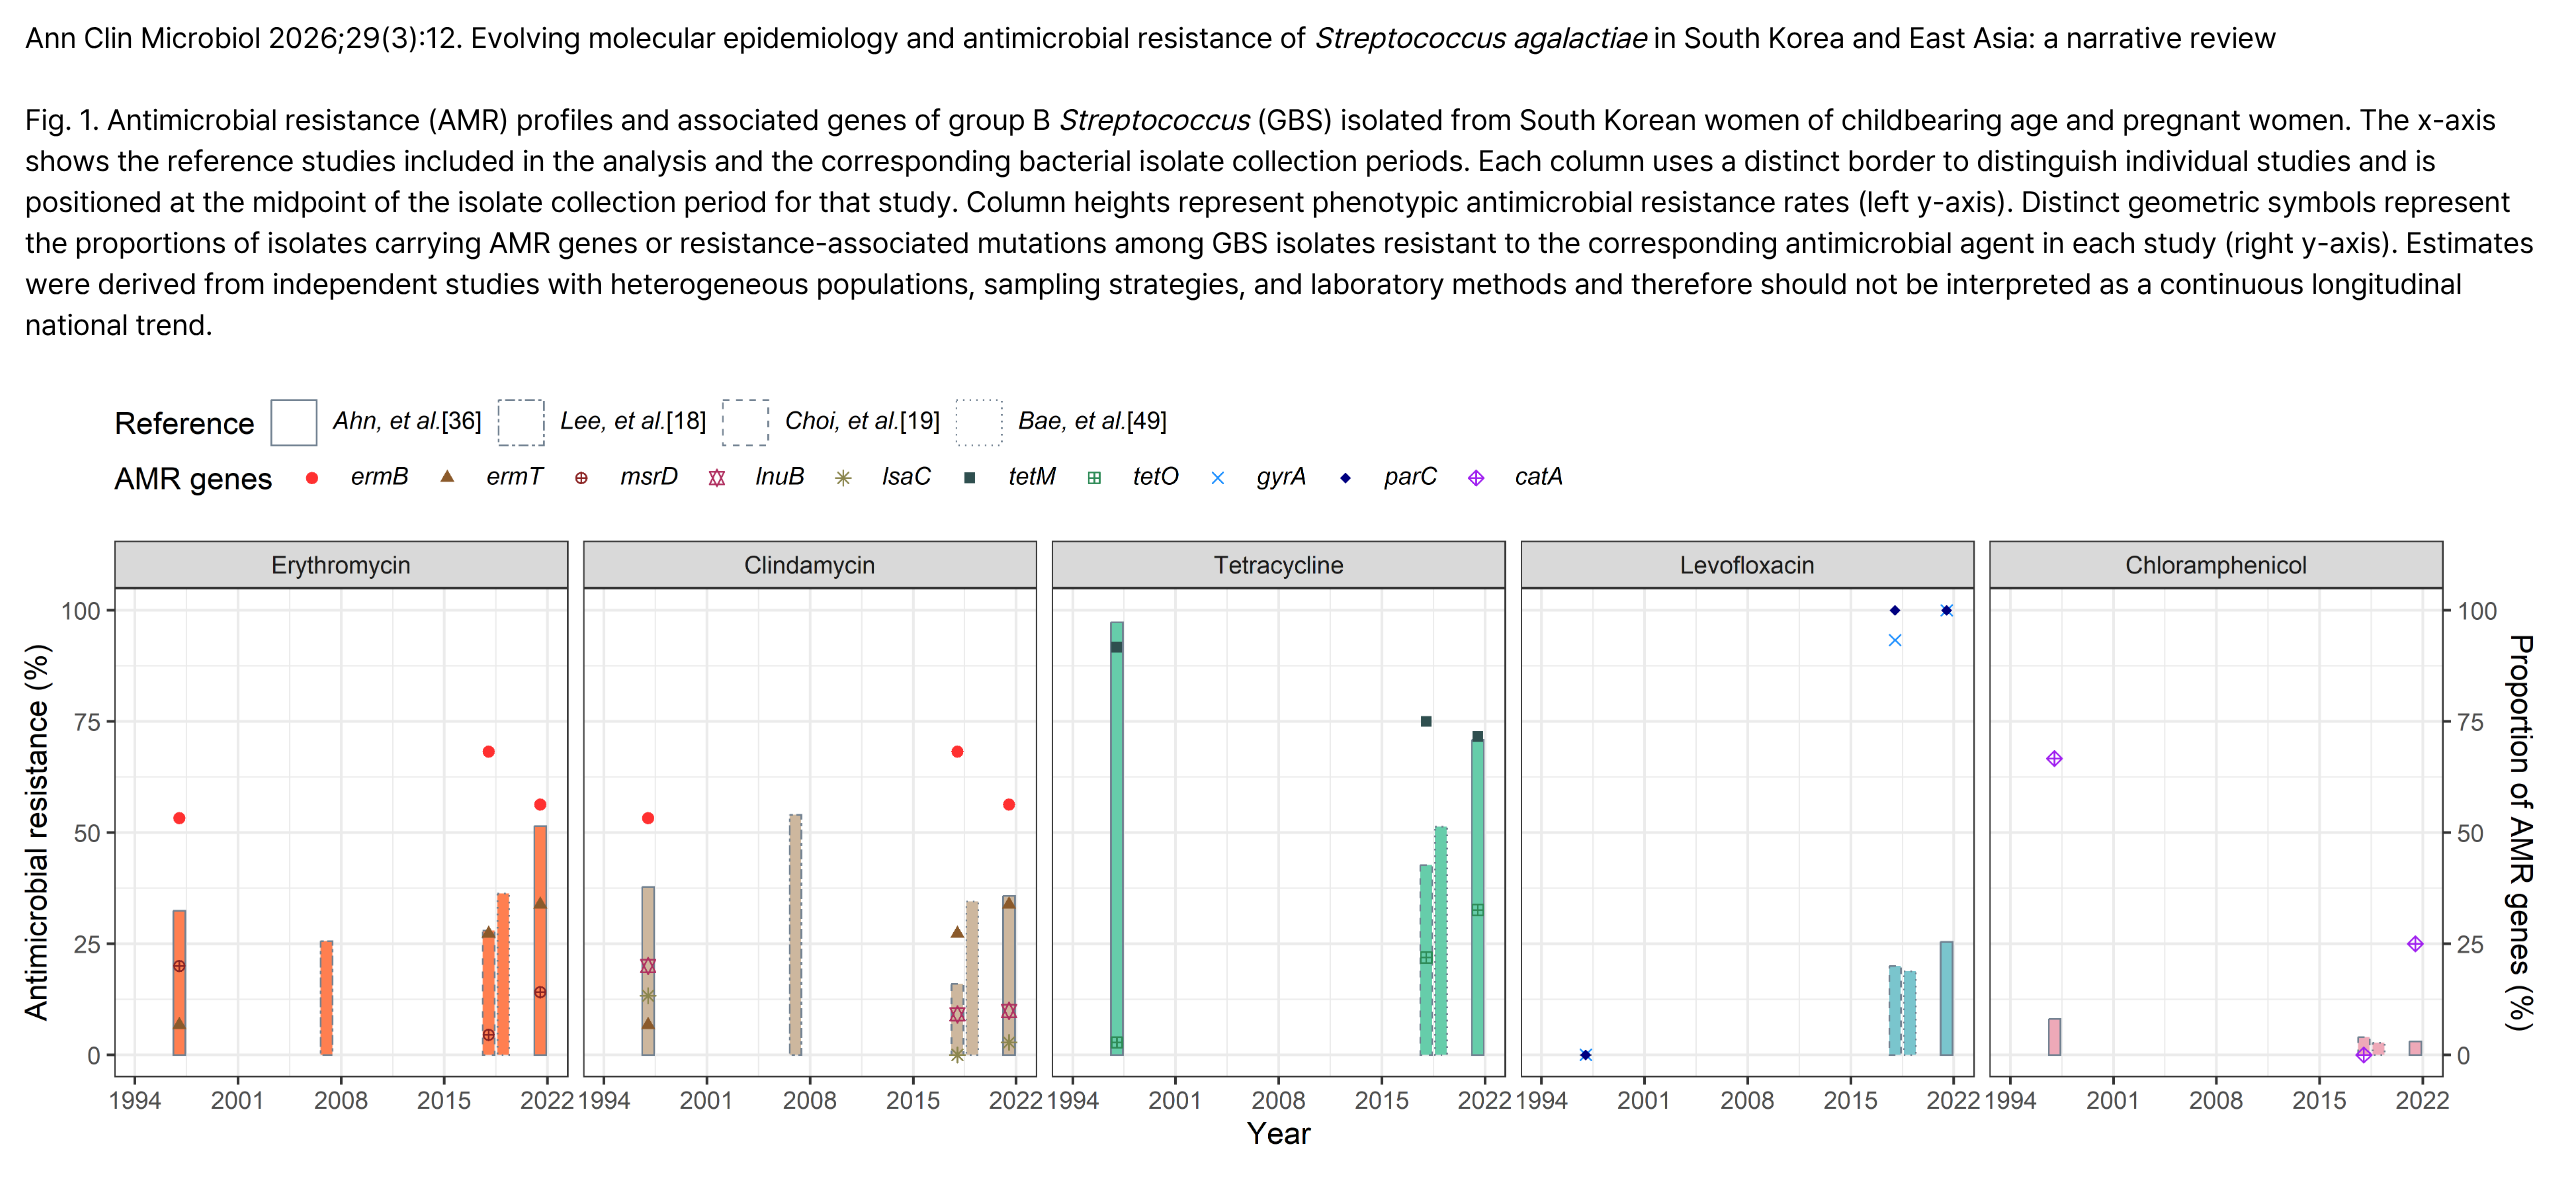
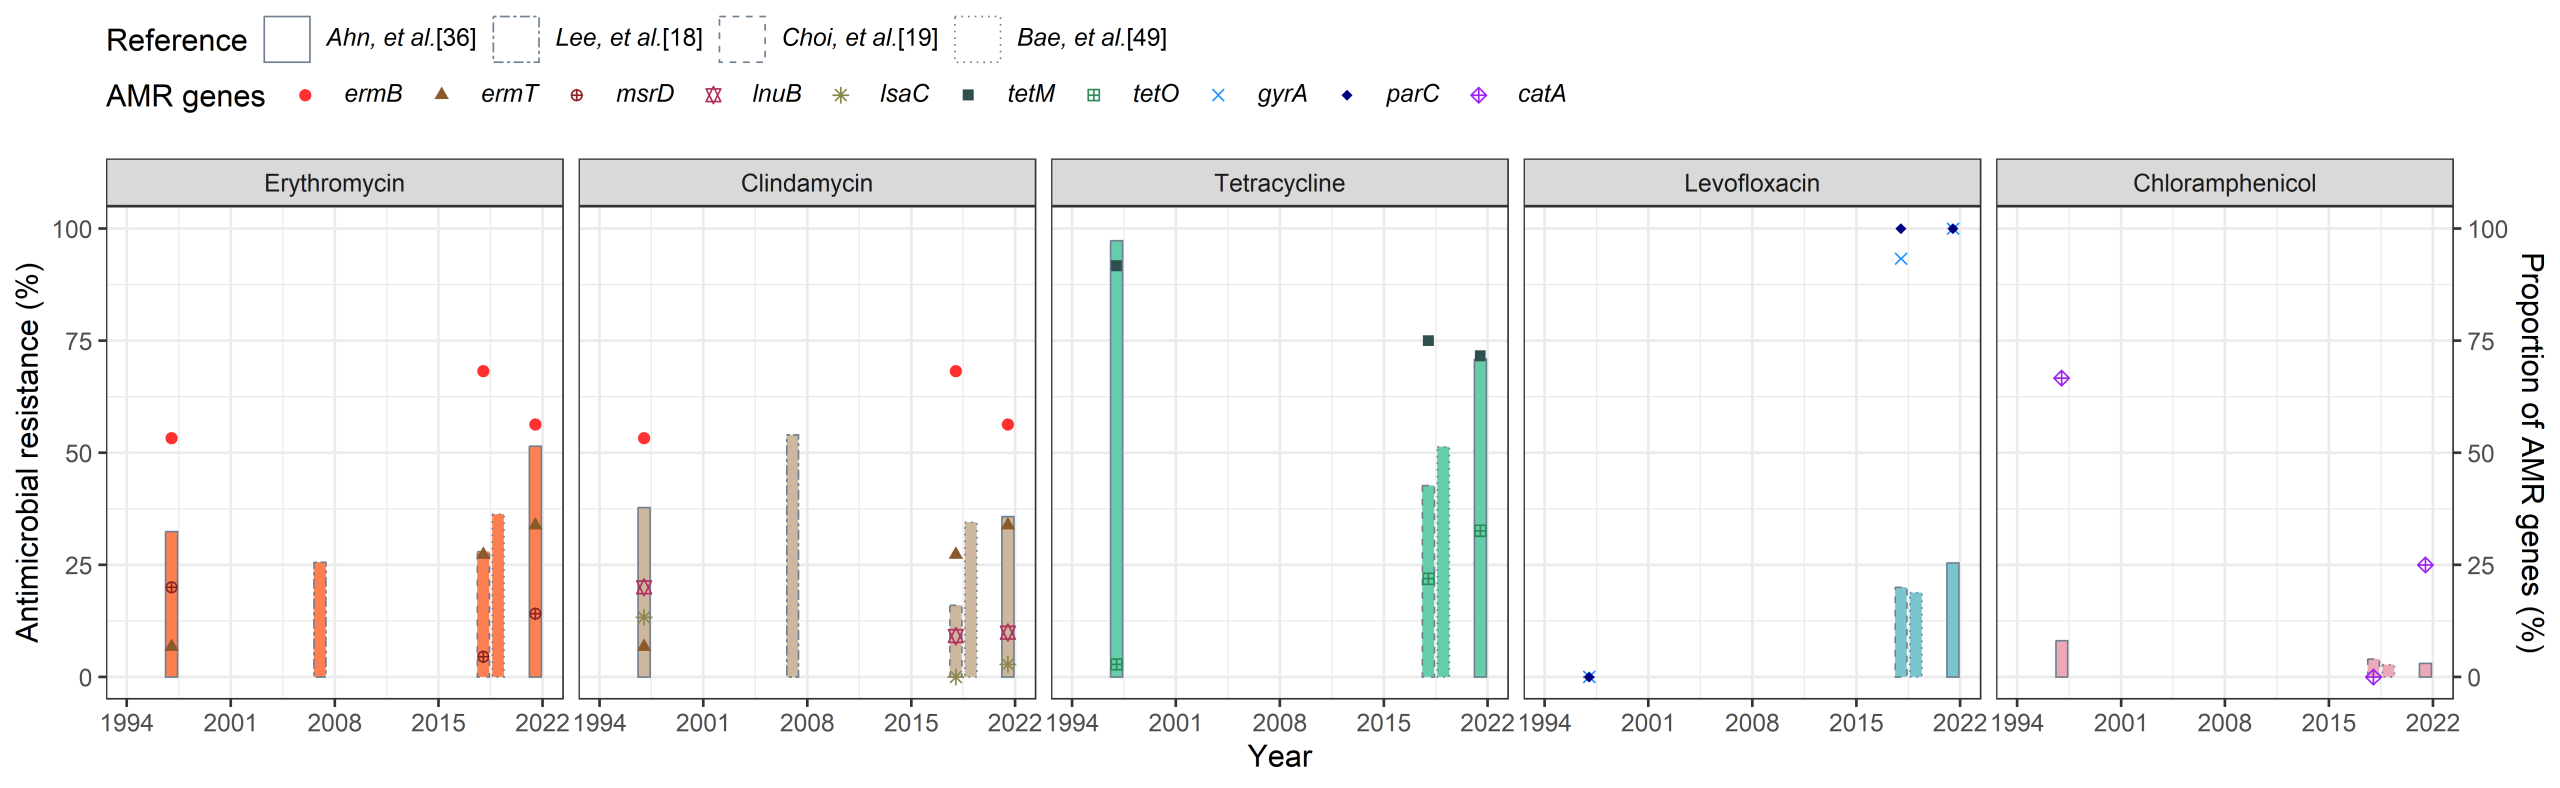
Fig. 1. Antimicrobial resistance (AMR) profiles and associated genes of group B Streptococcus (GBS) isolated from South Korean women of childbearing age and pregnant women. The x-axis shows the reference studies included in the analysis and the corresponding bacterial isolate collection periods. Each column uses a distinct border to distinguish individual studies and is positioned at the midpoint of the isolate collection period for that study. Column heights represent phenotypic antimicrobial resistance rates (left y-axis). Distinct geometric symbols represent the proportions of isolates carrying AMR genes or resistance-associated mutations among GBS isolates resistant to the corresponding antimicrobial agent in each study (right y-axis). Estimates were derived from independent studies with heterogeneous populations, sampling strategies, and laboratory methods and therefore should not be interpreted as a continuous longitudinal national trend.