Yu Jin Park1![]() , Xinyi Lu2
, Xinyi Lu2![]() , Sunghyuk Kim1
, Sunghyuk Kim1![]() , Shinyoung Yoon1
, Shinyoung Yoon1![]() , Daewon Kim3
, Daewon Kim3![]() , Ki Ho Hong1
, Ki Ho Hong1![]() , Hyukmin Lee1
, Hyukmin Lee1![]() , Dongeun Yong1,4
, Dongeun Yong1,4![]()
1Department of Laboratory Medicine and Research Institute of Bacterial Resistance, Yonsei University College of Medicine, Seoul, Korea
2Graduate School of Medicine, Yonsei University College of Medicine, Seoul, Korea
3Department of Laboratory Medicine, Gachon University Gil Medical Center, Incheon, Korea
4Brain Korea 21 PLUS Project for Medical Science, Yonsei University College of Medicine, Seoul, Korea
Correspondence to Dongeun Yong E-mail: deyong@yuhs.ac
Ann Clin Microbiol 2026;29(2):7. https://doi.org/10.5145/ACM.2026.29.2.7
Received on 23 March 2026, Revised on 11 May 2026, Accepted on 26 May 2026, Published on 20 June 2026.
Copyright © Korean Society of Clinical Microbiology.
This is an Open Access article which is freely available under the Creative Commons Attribution-NonCommercial-NoDerivatives 4.0 International License (CC BY-NC-ND) (https://creativecommons.org/licenses/by-nc-nd/4.0/).

Background: The optimal frequency for repeat antimicrobial susceptibility testing (AST) of isolates of the same species remain undefined despite its importance in antimicrobial therapy. This study assessed suitable repeat AST intervals by analyzing time-dependent changes in susceptibility patterns.
Methods: This retrospective observational study analyzed laboratory AST data collected over 10 years (2010–2019) from a tertiary hospital in Seoul, Korea. We examined AST results for “paired” (same patient, same day) and “successive” (same patient, different times: 1–7, 8–30, and 31–365 days) isolates of common bacterial species: Staphylococcus aureus, Enterococcus faecalis, Enterococcus faecium, Escherichia coli, Klebsiella pneumoniae, Acinetobacter baumannii complex, and Pseudomonas aeruginosa. The essential agreement (EA), categorical agreement (CA), essential MIC increase (EMI), and change from nonresistant to resistant (CNRR and CNRR+EMI) rates were calculated.
Results: Paired isolates showed > 90% CA for most species, although P. aeruginosa had a lower EA (71.5%) and CA (69.6%). For successive isolates, the EMI, CNRR, and CNRR+EMI generally increased over time. The S. aureus and E. faecalis species demonstrated high stability with low CNRR+EMI rates. Conversely, P. aeruginosa exhibited the most notable changes: its CNRR+EMI increased from 4.1% (1–7 days) to 6.6% (31–365 days), and its EMI remained the highest across all time periods, starting at 7.1% within 1–7 days.
Conclusion: The stability of antimicrobial susceptibility patterns varies considerably by bacterial species and time interval. For bacteria with low CNRR+EMI rates, such as S. aureus and E. faecalis, the frequency of repeat AST should be reduced, whereas for bacteria with variable susceptibility patterns, such as P. aeruginosa, more frequent retesting should be performed. The study findings could help laboratories optimize repeat AST protocols and balance timely resistance detection with optimal resource management.
Clinical laboratory services; Drug resistance, bacterial; Microbial sensitivity tests; Time factors
Antimicrobial susceptibility testing (AST) is a cornerstone of clinical microbiology; it guides the selection of appropriate antimicrobial therapies for patients [1]. However, a critical question remains unresolved: how frequently should AST be repeated when the same bacterial isolate is identified in a patient over time or across different specimen sites [2–4]? The decision to repeat AST is not trivial because changes in antimicrobial susceptibility can have considerable clinical implications, necessitating adjustments to treatment regimens. Despite the importance of this issue, current AST practices vary widely, and standardized guidelines on the optimal intervals for repeat testing are lacking [5,6].
Historically, studies addressing the frequency of repeat AST have been limited, with recommendations on timing ranging from a few days to several weeks [1,7]. For instance, one study reviewed duplicate AST results over a 1-year period and suggested varying retesting needs based on the organism: always for coagulase-negative staphylococci and Pseudomonas aeruginosa; after 3 days for Enterobacteriaceae; and not routinely for Staphylococcus aureus [7]. Furthermore, errors in initial AST or the presence of undetected resistant strains can delay the recognition of resistance, potentially compromising patient outcomes [2,7].
Despite efforts to standardize AST practices, such as those by EUCAST [8], optimal testing intervals have yet to be defined [2]. Studies have confirmed that changes in antimicrobial susceptibility patterns can occur, with frequencies varying considerably by bacterial species and specimen type. For instance, Köck et al. observed changes in antimicrobial susceptibility patterns in 14.9% of cases, with a median time of 5 days, highlighting the high variability [2]. Sarink et al. [1] further demonstrated that the resistance risk remained below 10% for S. aureus up to 30 days but reached approximately 10% within 7 days for Enterobacterales— the resistance risk was even higher for P. aeruginosa. Based on the clinical consensus that a 10% resistance rate is the maximum acceptable risk for selecting empirical treatment [9], Sarink et al. [1] proposed that a cumulative risk of resistance shifting below 10% may justify the omission of follow-up AST for serial isolates. Giltner et al. [3] presented cases in which a 5-day retesting interval was insufficient for timely resistance detection in methicillin-resistant Staphylococcus aureus bacteremia. This dynamic nature of bacterial resistance highlights the necessity for evidence-based guidelines that balance timely detection with cost-effective laboratory practices [2].
Considering these challenges, further research is urgently needed to establish clear standards for the timing and frequency of repeat AST. Such studies would provide the necessary evidence to inform clinical microbiology laboratories on how to optimize testing intervals and thus ensure the accurate detection of resistance while minimizing unnecessary testing [1,2]. The present study aimed to contribute to this knowledge gap by investigating the patterns and timing of susceptibility changes in bacterial isolates from the same patient over time, providing a foundation for future guidelines in repetitive AST practices, and assessing these changes in the context of clinically relevant thresholds, such as the 10% risk benchmark discussed in recent literature [1,9].
Data were collected from the clinical microbiology laboratory at Yonsei University Health System, a ~2,200-bed tertiary care hospital in Seoul, Korea. The dataset included sample types, sources, isolation dates, species identification, and minimum inhibitory concentration (MIC) results obtained from the Vitek 2 automated AST system (bioMérieux SA). This study focused on S. aureus, E. faecalis, E. faecium, Enterobacterales (Escherichia coli and Klebsiella pneumoniae), Acinetobacter baumannii complex, and P. aeruginosa. Data were gathered over a 10-year period from January 2010 to December 2019.
Bacterial isolates obtained from blood, urine, and respiratory samples were included. The BACTEC FX (BD, Franklin Lakes) and BacT/ALERT (bioMérieux) Blood Culture Systems were used for blood cultures, and blood and MacConkey agar media used for urine, sputum, bronchial aspirate, and bronchoalveolar lavage fluid cultures. All plates were incubated overnight at 35°C in 5% CO2 or ambient air. Species identification was performed using conventional biochemical tests, a commercial identification system (VITEK), or matrix-assisted laser desorption/ionization time-of-flight mass spectrometry (Bruker Daltonics).
AST was carried out using the Vitek 2 system. Raw MIC data were interpreted using the Clinical and Laboratory Standards Institute (CLSI) guideline in effect for the year [10]. Only clinically relevant antibiotics from the Vitek card were included: 17 for S. aureus, 10 for E. faecalis, 11 for E. faecium, 12 for E. coli, 17 for K. pneumoniae, 15 for A. baumannii complex, and 12 for P. aeruginosa.
The terms described below were defined according to the definitions of Sarink et al. [1]. We defined “paired” isolates as two microorganisms with similar species identification that originated from different anatomical sites of one patient on the same day. We defined “successive” isolates as two microorganisms with similar species identification that were cultured from the same patient at two different time points. For successive isolates, we constructed isolate pairs by linking each isolate to the immediately subsequent isolate of the same species from the same patient, and categorized pairs by time interval (1–7, 8–30, 31–365 days). If multiple isolates occurred within a given interval, all adjacent pairs were considered to reduce within-patient clustering.
We calculated the categorical agreement (CA) and essential agreement (EA) of “paired” and “successive” isolates according to the CLSI guideline [10]. CA was defined as “paired” or “successive” isolates that yielded the same categorical interpretation (susceptible, intermediate, or resistant). EA was defined as “paired” or “successive” isolates with an MIC result within ±1 doubling-dilution. Both the CA and EA measure changes in two directions (e.g., from resistant to susceptible and vice versa, and from a higher to lower MIC and vice versa). For “successive” isolates, only MIC increases and changes from nonresistant to resistant are typically considered most clinically relevant for evaluating potential treatment failure. Therefore, we adopted and adapted the following terms used by Sarink et al. [1]: essential MIC increase (EMI) was defined as an MIC increase of 2 doubling-dilutions over time in “successive” isolates; change from nonresistant to resistant (CNRR) was defined as a change in categorical interpretation from susceptible or intermediate to resistant over time in “successive” isolates. “CNRR+EMI” represented a stricter category combining both the CNRR and EMI, indicating a change to resistant that is also accompanied by at least a fourfold increase in MIC.
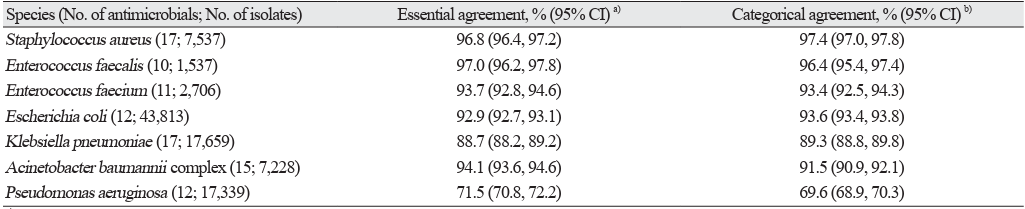
The EA and CA of paired isolates are presented in Table 1, which includes data for S. aureus, E. faecalis, E. faecium, E. coli, K. pneumoniae, A. baumannii complex, and P. aeruginosa. Overall, the CA was generally high across most species, ranging from 69.6% for P. aeruginosa to 97.4% for S. aureus. Moreover, the EA percentages varied, with P. aeruginosa showing the lowest EA at 71.5% and E. faecalis the highest at 97.0%.
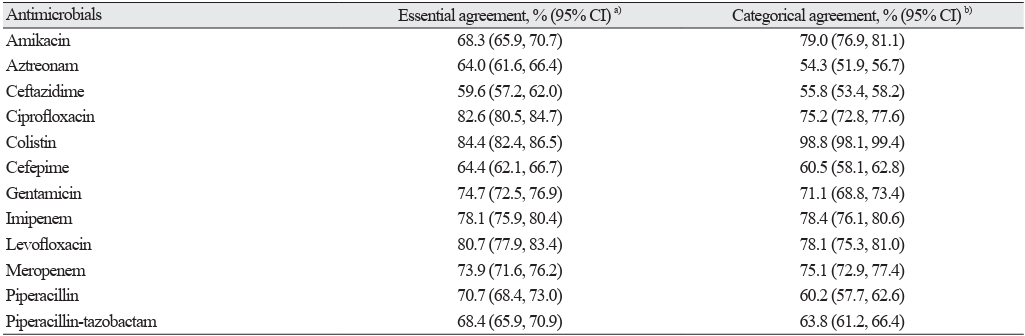
Table 2 details the EA and CA for specific antimicrobial agents tested against P. aeruginosa in paired isolates (n = 17,339). Agreement rates varied considerably among the tested antibiotics. For instance, colistin showed a high CA of 98.8% but lower EA of 84.4%. In contrast, ceftazidime had the lowest agreement rates, demonstrating an EA of 59.6% and CA of 55.8%. Other agents such as ciprofloxacin and levofloxacin showed a moderate EA (82.6% and 80.7%, respectively) and CA (75.2% and 78.1%, respectively). Carbapenems such as imipenem and meropenem had respective EAs of 78.1% and 73.9% and respective CAs of 78.4% and 75.1%.
Table 1. Essential and categorical agreement of antimicrobial susceptibility test results for paired isolates from the same patient on the same day
| Species (No. of antimicrobials; No. of isolates) | Essential agreement, % (95% CI)a) | Categorical agreement, % (95% CI)b) |
|---|---|---|
| Staphylococcus aureus (17; 7,537) | 96.8 (96.4, 97.2) | 97.4 (97.0, 97.8) |
| Enterococcus faecalis (10; 1,537) | 97.0 (96.2, 97.8) | 96.4 (95.4, 97.4) |
| Enterococcus faecium (11; 2,706) | 93.7 (92.8, 94.6) | 93.4 (92.5, 94.3) |
| Escherichia coli (12; 43,813) | 92.9 (92.7, 93.1) | 93.6 (93.4, 93.8) |
| Klebsiella pneumoniae (17; 17,659) | 88.7 (88.2, 89.2) | 89.3 (88.8, 89.8) |
| Acinetobacter baumannii complex (15; 7,228) | 94.1 (93.6, 94.6) | 91.5 (90.9, 92.1) |
| Pseudomonas aeruginosa (12; 17,339) | 71.5 (70.8, 72.2) | 69.6 (68.9, 70.3) |
a) Essential Agreement: Two isolates with the same identification from the same patient isolated on the same day with a MIC that is within 1 doubling-dilution in every tested antibiotic.
b) Categorical Agreement: Two isolates with the same identification from the same patient isolated on the same day that yielded the same categorical interpretation in every tested antibiotic. Abbreviation: CI, confidence interval.
Table 2. Essential and categorical agreement for specific antimicrobials tested against paired Pseudomonas aeruginosa isolates from the same patient on the same day (n = 17,339)
| Antimicrobials | Essential agreement, % (95% CI)a) | Categorical agreement, % (95% CI)b) |
|---|---|---|
| Amikacin | 68.3 (65.9, 70.7) | 79.0 (76.9, 81.1) |
| Aztreonam | 64.0 (61.6, 66.4) | 54.3 (51.9, 56.7) |
| Ceftazidime | 59.6 (57.2, 62.0) | 55.8 (53.4, 58.2) |
| Ciprofloxacin | 82.6 (80.5, 84.7) | 75.2 (72.8, 77.6) |
| Colistin | 84.4 (82.4, 86.5) | 98.8 (98.1, 99.4) |
| Cefepime | 64.4 (62.1, 66.7) | 60.5 (58.1, 62.8) |
| Gentamicin | 74.7 (72.5, 76.9) | 71.1 (68.8, 73.4) |
| Imipenem | 78.1 (75.9, 80.4) | 78.4 (76.1, 80.6) |
| Levofloxacin | 80.7 (77.9, 83.4) | 78.1 (75.3, 81.0) |
| Meropenem | 73.9 (71.6, 76.2) | 75.1 (72.9, 77.4) |
| Piperacillin | 70.7 (68.4, 73.0) | 60.2 (57.7, 62.6) |
| Piperacillin-tazobactam | 68.4 (65.9, 70.9) | 63.8 (61.2, 66.4) |
a) Essential Agreement: Two isolates with the same identification from the same patient isolated on the same day with a MIC that is within 1 doubling-dilution in every tested antibiotic.Essential Agreement: Two isolates with the same identification from the same patient isolated on the same day with a MIC that is within 1 doubling-dilution in every tested antibiotic.
b)Categorical Agreement: Two isolates with the same identification from the same patient isolated on the same day that yielded the same categorical interpretation in every tested antibiotic.
Abbreviation: CI, confidence interval.
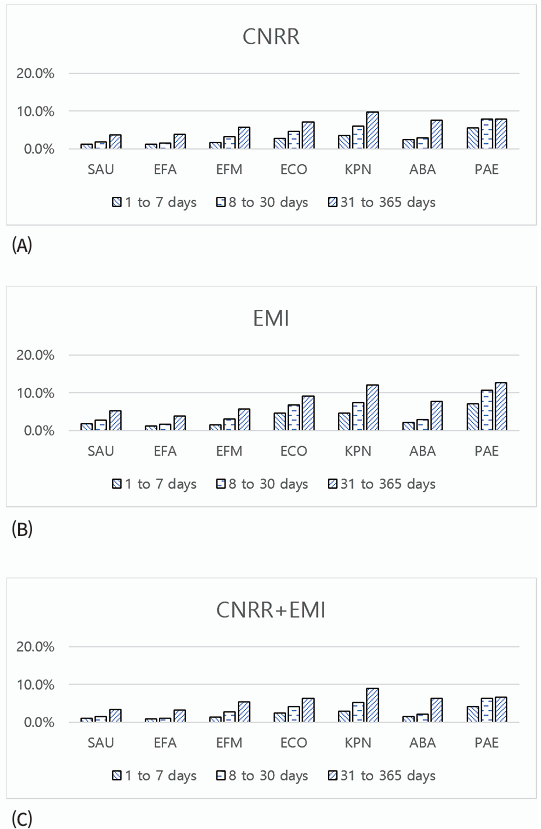
The analysis of successive isolates involved comparing AST results from the same microorganism isolated from the same patient at different time points. Fig. 1 presents the EMI, CNRR, and CNRR+EMI results of the seven common bacterial species tested across three time intervals, namely: 1–7, 8–30, and 31–365 days.
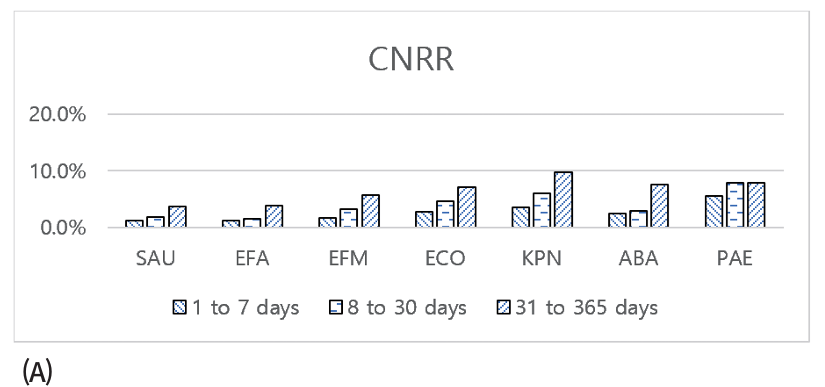
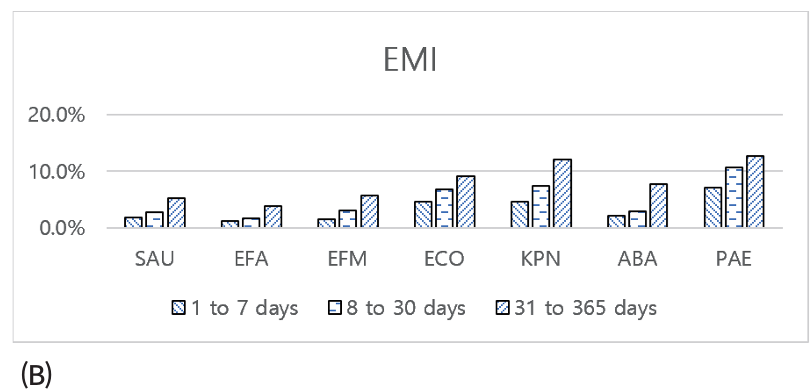
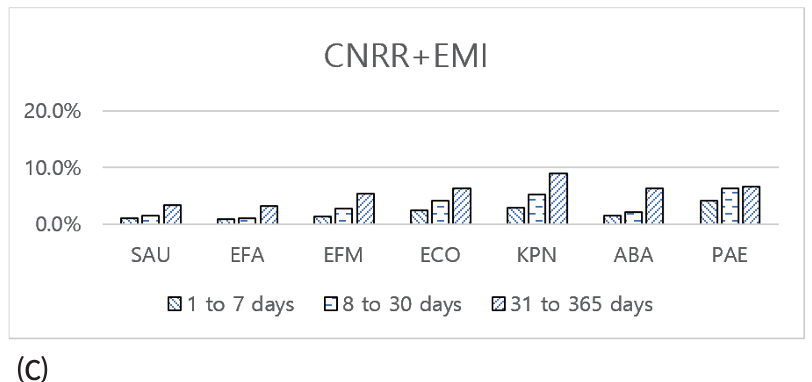
Fig. 1. Proportion (%) of the (A) CNRR, (B) EMI, and (C) CNRR+EMI rates of the tested antibiotics for “successive” isolates (a successive isolate comprises two microorganisms with the same species identification obtained at two different time points from the same patient). CNRR, change from nonresistant to resistant; EMI, essential MIC increase; SAU, Staphylococcus aureus; EFA, Enterococcus faecalis; EFM, Enterococcus faecium; ECO, Escherichia coli; KPN, Klebsiella pneumoniae; ABA, Acinetobacter baumannii complex; PAE, Pseudomonas aeruginosa.
Generally, the EMI, CNRR, and CNRR+EMI rates tended to increase with longer time intervals across all microorganisms. The S. aureus and E. faecalis species maintained low CNRR+EMI rates even at the longest intervals, demonstrating high stability. Conversely, E. faecium, E. coli, K. pneumoniae, and A. baumannii complex showed gradual increases in CNRR+EMI over time. The most notable changes were observed for P. aeruginosa. Specifically, its CNRR+EMI was 4.1% within 1–7 days, increasing to 6.3% by 8–30 days and remaining relatively stable at 6.6% in the 31–365 days interval. The EMI for P. aeruginosa was the highest among all tested species across all time periods, starting at 7.1% within 1–7 days. Although the CNRR+EMI of P. aeruginosa stabilized at longer intervals due to the higher proportion of initially resistant isolates, it remained at the second highest rate after K. pneumoniae at the longest interval.
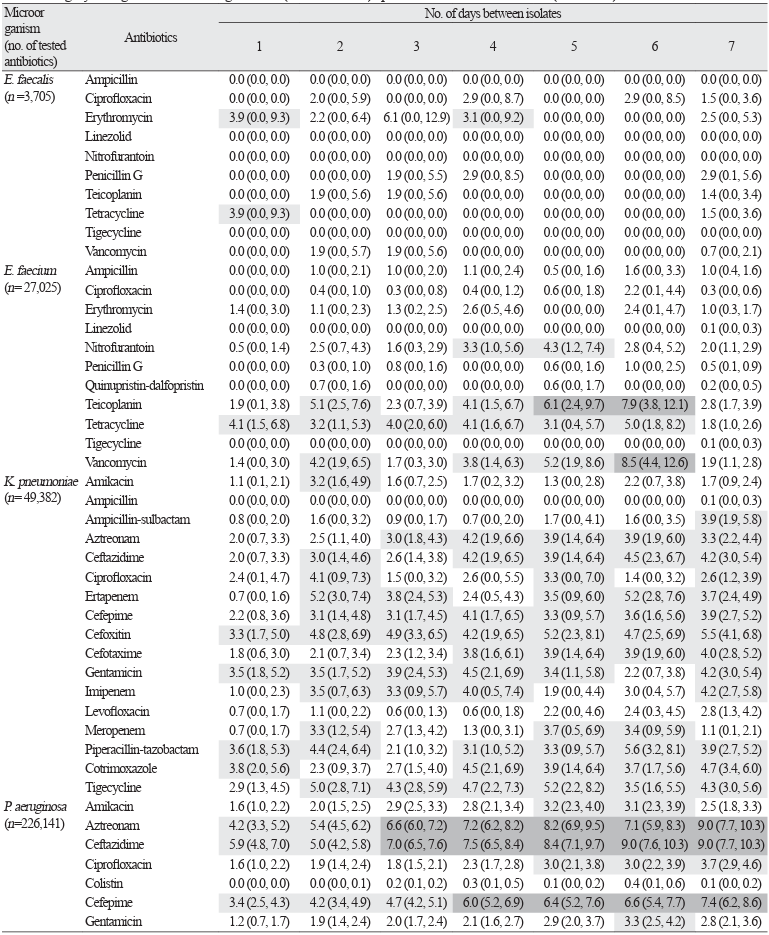
Within the first 7 days, a detailed analysis of CNRR+EMI frequencies revealed distinct changes in susceptibility patterns among the pathogens studied (Table 3). For each species, the CNRR+EMI values also varied by antibiotic, indicating that susceptibility changes likely depend on the drug used. For example, P. aeruginosa exhibited frequent antimicrobial susceptibility variations, exhibiting increased CNRR+EMI values greater than 3% across 5 of the 12 tested antibiotics within 24 h. In contrast, K. pneumoniae and E. coli showed moderate but consistent susceptibility changes.
Table 3. Proportion (%) of “successive” isolates with categorical change from nonresistant to resistant when the MIC change leading to this category change was >1 doubling dilution (CNRR + EMI) specified for each antibiotic a) b)
| Microorganism (no. of tested antibiotics) | Antibiotics | No. of days between isolates | ||||||
|---|---|---|---|---|---|---|---|---|
| 1 | 2 | 3 | 4 | 5 | 6 | 7 | ||
| A. baumannii (n= 47,274) | Ampicillin-sulbactam | 2.0 (0.4, 3.5) | 0.3 (0.0, 0.8) | 0.9 (0.1, 1.8) | 1.6 (0.0, 3.2) | 2.0 (0.1, 4.0) | 2.2 (0.7, 3.8) | 1.0 (0.4, 1.5) |
| Ceftazidime | 1.7 (0.2, 3.1) | 0.8 (0.0, 1.7) | 1.3 (0.3, 2.3) | 1.6 (0.0, 3.2) | 2.0 (0.1, 4.0) | 2.2 (0.7, 3.8) | 1.4 (0.8, 2.1) | |
| Ciprofloxacin | 1.7 (0.2, 3.1) | 0.3 (0.0, 0.8) | 0.6 (0.0, 1.2) | 1.2 (0.0, 2.6) | 2.0 (0.1, 4.0) | 1.7 (0.3, 3.0) | 0.8 (0.3, 1.3) | |
| Colistin | 1.0 (0.0, 2.1) | 3.9 (1.9, 5.9) | 3.1 (1.6, 4.5) | 1.6 (0.0, 3.2) | 4.5 (1.6, 7.5) | 1.4 (0.2, 2.7) | 1.1 (0.5, 1.6) | |
| Cefepime | 3.9 (1.7, 6.1) | 1.9 (0.5, 3.3) | 2.1 (0.9, 3.3) | 1.2 (0.0, 2.6) | 2.5 (0.3, 4.7) | 3.7 (1.7, 5.6) | 2.1 (1.3, 2.9) | |
| Cefotaxime | 1.0 (0.0, 2.1) | 0.3 (0.0, 0.8) | 0.8 (0.0, 1.5) | 0.8 (0.0, 1.9) | 2.0 (0.1, 4.0) | 2.0 (0.5, 3.4) | 0.9 (0.4, 1.4) | |
| Gentamicin | 2.3 (0.6, 4.0) | 3.2 (1.4, 5.1) | 3.8 (2.1, 5.4) | 2.0 (0.3, 3.8) | 5.0 (2.0, 8.1) | 2.0 (0.5, 3.4) | 2.2 (1.4, 3.1) | |
| Imipenem | 1.7 (0.2, 3.1) | 0.3 (0.0, 0.8) | 1.1 (0.2, 2.0) | 2.0 (0.3, 3.8) | 2.5 (0.3, 4.7) | 1.4 (0.2, 2.7) | 1.4 (0.7, 2.0) | |
| Levofloxacin | 0.8 (0.0, 1.9) | 0.0 (0.0, 0.0) | 0.9 (0.0, 1.8) | 1.5 (0.0, 3.1) | 2.2 (0.1, 4.4) | 2.2 (0.4, 3.9) | 0.8 (0.3, 1.4) | |
| Meropenem | 1.6 (0.2, 3.1) | 0.3 (0.0, 0.8) | 1.3 (0.3, 2.3) | 2.4 (0.5, 4.3) | 2.5 (0.3, 4.7) | 1.4 (0.2, 2.7) | 1.4 (0.8, 2.1) | |
| Minocycline | 1.0 (0.0, 2.1) | 1.1 (0.0, 2.1) | 0.8 (0.0, 1.5) | 3.6 (1.3, 5.9) | 1.0 (0.0, 2.4) | 1.7 (0.3, 3.0) | 0.9 (0.4, 1.4) | |
| Piperacillin | 1.0 (0.0, 2.1) | 0.3 (0.0, 0.8) | 0.8 (0.0, 1.5) | 0.8 (0.0, 1.9) | 2.0 (0.1, 4.0) | 1.1 (0.0, 2.2) | 0.8 (0.3, 1.3) | |
| Piperacillin-tazobactam | 1.3 (0.0, 2.6) | 0.3 (0.0, 0.8) | 1.1 (0.2, 2.0) | 1.2 (0.0, 2.6) | 1.5 (0.0, 3.2) | 1.4 (0.2, 2.7) | 1.2 (0.6, 1.8) | |
| Cotrimoxazole | 4.3 (2.0, 6.6) | 4.1 (2.1, 6.1) | 2.5 (1.1, 3.8) | 5.3 (2.5, 8.1) | 3.6 (1.0, 6.2) | 5.4 (3.0, 7.7) | 3.0 (2.0, 3.9) | |
| Tigecycline | 1.8 (0.0, 3.6) | 5.3 (2.6, 8.0) | 1.2 (0.2, 2.3) | 2.7 (0.4, 5.0) | 3.5 (0.5, 6.6) | 1.5 (0.0, 3.0) | 1.7 (0.8, 2.6) | |
| E. coli (n= 20,514) | Amikacin | 0.3 (0.0, 0.8) | 1.0 (0.0, 2.3) | 0.4 (0.0, 1.2) | 0.8 (0.0, 2.5) | 1.0 (0.0, 3.0) | 0.7 (0.0, 2.2) | 0.3 (0.0, 0.8) |
| Ampicillin | 1.3 (0.2, 2.5) | 1.0 (0.0, 2.3) | 0.8 (0.0, 2.0) | 0.9 (0.0, 2.5) | 5.1 (0.7, 9.4) | 0.7 (0.0, 2.2) | 2.0 (0.9, 3.2) | |
| Aztreonam | 3.1 (1.4, 4.9) | 3.4 (0.9, 5.8) | 2.9 (0.8, 5.0) | 11.0 (5.3, 16.7) | 7.1 (2.0, 12.1) | 5.1 (1.4, 8.8) | 4.0 (2.4, 5.5) | |
| Ceftazidime | 2.1 (0.7, 3.6) | 2.4 (0.3, 4.4) | 1.7 (0.0, 3.3) | 9.3 (4.1, 14.6) | 6.1 (1.4, 10.9) | 4.4 (0.9, 7.9) | 4.6 (2.9, 6.3) | |
| Ertapenem | 0.3 (0.0, 0.9) | 0.0 (0.0, 0.0) | 0.0 (0.0, 0.0) | 2.2 (0.0, 5.3) | 0.0 (0.0, 0.0) | 0.9 (0.0, 2.6) | 0.4 (0.0, 1.0) | |
| Cefepime | 1.2 (0.0, 2.3) | 1.6 (0.0, 3.4) | 1.9 (0.1, 3.7) | 10.5 (4.6, 16.4) | 4.4 (0.2, 8.6) | 2.5 (0.0, 5.3) | 5.0 (3.1, 6.9) | |
| Cefoxitin | 0.5 (0.0, 1.3) | 2.4 (0.3, 4.5) | 3.3 (1.1, 5.6) | 1.7 (0.0, 4.1) | 5.1 (0.7, 9.4) | 4.4 (1.0, 7.9) | 3.0 (1.6, 4.3) | |
| Cefotaxime | 1.8 (0.5, 3.2) | 2.4 (0.3, 4.4) | 1.7 (0.0, 3.3) | 6.8 (2.2, 11.4) | 8.2 (2.7, 13.6) | 5.2 (1.4, 8.9) | 3.2 (1.8, 4.5) | |
| Gentamicin | 1.8 (0.5, 3.2) | 2.4 (0.3, 4.5) | 2.9 (0.8, 5.0) | 2.5 (0.0, 5.4) | 6.0 (1.3, 10.7) | 2.2 (0.0, 4.6) | 3.7 (2.2, 5.2) | |
| Piperacillin-tazobactam | 1.1 (0.0, 2.1) | 0.5 (0.0, 1.5) | 0.9 (0.0, 2.1) | 6.0 (1.7, 10.4) | 5.5 (0.8, 10.2) | 2.4 (0.0, 5.1) | 2.0 (0.8, 3.1) | |
| Cotrimoxazole | 2.1 (0.7, 3.6) | 2.9 (0.6, 5.1) | 2.5 (0.5, 4.5) | 5.1 (1.1, 9.1) | 4.0 (0.1, 7.9) | 2.2 (0.0, 4.7) | 3.5 (2.0, 4.9) | |
| Tigecycline | 0.0 (0.0, 0.0) | 0.0 (0.0, 0.0) | 0.5 (0.0, 1.4) | 0.0 (0.0, 0.0) | 0.0 (0.0, 0.0) | 0.0 (0.0, 0.0) | 0.0 (0.0, 0.0) | |
| E. faecalis (n=3,705) | Ampicillin | 0.0 (0.0, 0.0) | 0.0 (0.0, 0.0) | 0.0 (0.0, 0.0) | 0.0 (0.0, 0.0) | 0.0 (0.0, 0.0) | 0.0 (0.0, 0.0) | 0.0 (0.0, 0.0) |
| Ciprofloxacin | 0.0 (0.0, 0.0) | 2.0 (0.0, 5.9) | 0.0 (0.0, 0.0) | 2.9 (0.0, 8.7) | 0.0 (0.0, 0.0) | 2.9 (0.0, 8.5) | 1.5 (0.0, 3.6) | |
| Erythromycin | 3.9 (0.0, 9.3) | 2.2 (0.0, 6.4) | 6.1 (0.0, 12.9) | 3.1 (0.0, 9.2) | 0.0 (0.0, 0.0) | 0.0 (0.0, 0.0) | 2.5 (0.0, 5.3) | |
| Linezolid | 0.0 (0.0, 0.0) | 0.0 (0.0, 0.0) | 0.0 (0.0, 0.0) | 0.0 (0.0, 0.0) | 0.0 (0.0, 0.0) | 0.0 (0.0, 0.0) | 0.0 (0.0, 0.0) | |
| Nitrofurantoin | 0.0 (0.0, 0.0) | 0.0 (0.0, 0.0) | 0.0 (0.0, 0.0) | 0.0 (0.0, 0.0) | 0.0 (0.0, 0.0) | 0.0 (0.0, 0.0) | 0.0 (0.0, 0.0) | |
| Penicillin G | 0.0 (0.0, 0.0) | 0.0 (0.0, 0.0) | 1.9 (0.0, 5.5) | 2.9 (0.0, 8.5) | 0.0 (0.0, 0.0) | 0.0 (0.0, 0.0) | 2.9 (0.1, 5.6) | |
| Teicoplanin | 0.0 (0.0, 0.0) | 1.9 (0.0, 5.6) | 1.9 (0.0, 5.6) | 0.0 (0.0, 0.0) | 0.0 (0.0, 0.0) | 0.0 (0.0, 0.0) | 1.4 (0.0, 3.4) | |
| Tetracycline | 3.9 (0.0, 9.3) | 0.0 (0.0, 0.0) | 0.0 (0.0, 0.0) | 0.0 (0.0, 0.0) | 0.0 (0.0, 0.0) | 0.0 (0.0, 0.0) | 1.5 (0.0, 3.6) | |
| Tigecycline | 0.0 (0.0, 0.0) | 0.0 (0.0, 0.0) | 0.0 (0.0, 0.0) | 0.0 (0.0, 0.0) | 0.0 (0.0, 0.0) | 0.0 (0.0, 0.0) | 0.0 (0.0, 0.0) | |
| Vancomycin | 0.0 (0.0, 0.0) | 1.9 (0.0, 5.7) | 1.9 (0.0, 5.6) | 0.0 (0.0, 0.0) | 0.0 (0.0, 0.0) | 0.0 (0.0, 0.0) | 0.7 (0.0, 2.1) | |
| E. faecium (n= 27,025) | Ampicillin | 0.0 (0.0, 0.0) | 1.0 (0.0, 2.1) | 1.0 (0.0, 2.0) | 1.1 (0.0, 2.4) | 0.5 (0.0, 1.6) | 1.6 (0.0, 3.3) | 1.0 (0.4, 1.6) |
| Ciprofloxacin | 0.0 (0.0, 0.0) | 0.4 (0.0, 1.0) | 0.3 (0.0, 0.8) | 0.4 (0.0, 1.2) | 0.6 (0.0, 1.8) | 2.2 (0.1, 4.4) | 0.3 (0.0, 0.6) | |
| Erythromycin | 1.4 (0.0, 3.0) | 1.1 (0.0, 2.3) | 1.3 (0.2, 2.5) | 2.6 (0.5, 4.6) | 0.0 (0.0, 0.0) | 2.4 (0.1, 4.7) | 1.0 (0.3, 1.7) | |
| Linezolid | 0.0 (0.0, 0.0) | 0.0 (0.0, 0.0) | 0.0 (0.0, 0.0) | 0.0 (0.0, 0.0) | 0.0 (0.0, 0.0) | 0.0 (0.0, 0.0) | 0.1 (0.0, 0.3) | |
| Nitrofurantoin | 0.5 (0.0, 1.4) | 2.5 (0.7, 4.3) | 1.6 (0.3, 2.9) | 3.3 (1.0, 5.6) | 4.3 (1.2, 7.4) | 2.8 (0.4, 5.2) | 2.0 (1.1, 2.9) | |
| Penicillin G | 0.0 (0.0, 0.0) | 0.3 (0.0, 1.0) | 0.8 (0.0, 1.6) | 0.0 (0.0, 0.0) | 0.6 (0.0, 1.6) | 1.0 (0.0, 2.5) | 0.5 (0.1, 0.9) | |
| Quinupristin-dalfopristin | 0.0 (0.0, 0.0) | 0.7 (0.0, 1.6) | 0.0 (0.0, 0.0) | 0.0 (0.0, 0.0) | 0.6 (0.0, 1.7) | 0.0 (0.0, 0.0) | 0.2 (0.0, 0.5) | |
| Teicoplanin | 1.9 (0.1, 3.8) | 5.1 (2.5, 7.6) | 2.3 (0.7, 3.9) | 4.1 (1.5, 6.7) | 6.1 (2.4, 9.7) | 7.9 (3.8, 12.1) | 2.8 (1.7, 3.9) | |
| Tetracycline | 4.1 (1.5, 6.8) | 3.2 (1.1, 5.3) | 4.0 (2.0, 6.0) | 4.1 (1.6, 6.7) | 3.1 (0.4, 5.7) | 5.0 (1.8, 8.2) | 1.8 (1.0, 2.6) | |
| Tigecycline | 0.0 (0.0, 0.0) | 0.0 (0.0, 0.0) | 0.0 (0.0, 0.0) | 0.0 (0.0, 0.0) | 0.0 (0.0, 0.0) | 0.0 (0.0, 0.0) | 0.1 (0.0, 0.3) | |
| Vancomycin | 1.4 (0.0, 3.0) | 4.2 (1.9, 6.5) | 1.7 (0.3, 3.0) | 3.8 (1.4, 6.3) | 5.2 (1.9, 8.6) | 8.5 (4.4, 12.6) | 1.9 (1.1, 2.8) | |
| K. pneumoniae (n= 49,382) | Amikacin | 1.1 (0.1, 2.1) | 3.2 (1.6, 4.9) | 1.6 (0.7, 2.5) | 1.7 (0.2, 3.2) | 1.3 (0.0, 2.8) | 2.2 (0.7, 3.8) | 1.7 (0.9, 2.4) |
| Ampicillin | 0.0 (0.0, 0.0) | 0.0 (0.0, 0.0) | 0.0 (0.0, 0.0) | 0.0 (0.0, 0.0) | 0.0 (0.0, 0.0) | 0.0 (0.0, 0.0) | 0.1 (0.0, 0.3) | |
| Ampicillin-sulbactam | 0.8 (0.0, 2.0) | 1.6 (0.0, 3.2) | 0.9 (0.0, 1.7) | 0.7 (0.0, 2.0) | 1.7 (0.0, 4.1) | 1.6 (0.0, 3.5) | 3.9 (1.9, 5.8) | |
| Aztreonam | 2.0 (0.7, 3.3) | 2.5 (1.1, 4.0) | 3.0 (1.8, 4.3) | 4.2 (1.9, 6.6) | 3.9 (1.4, 6.4) | 3.9 (1.9, 6.0) | 3.3 (2.2, 4.4) | |
| Ceftazidime | 2.0 (0.7, 3.3) | 3.0 (1.4, 4.6) | 2.6 (1.4, 3.8) | 4.2 (1.9, 6.5) | 3.9 (1.4, 6.4) | 4.5 (2.3, 6.7) | 4.2 (3.0, 5.4) | |
| Ciprofloxacin | 2.4 (0.1, 4.7) | 4.1 (0.9, 7.3) | 1.5 (0.0, 3.2) | 2.6 (0.0, 5.5) | 3.3 (0.0, 7.0) | 1.4 (0.0, 3.2) | 2.6 (1.2, 3.9) | |
| Ertapenem | 0.7 (0.0, 1.6) | 5.2 (3.0, 7.4) | 3.8 (2.4, 5.3) | 2.4 (0.5, 4.3) | 3.5 (0.9, 6.0) | 5.2 (2.8, 7.6) | 3.7 (2.4, 4.9) | |
| Cefepime | 2.2 (0.8, 3.6) | 3.1 (1.4, 4.8) | 3.1 (1.7, 4.5) | 4.1 (1.7, 6.5) | 3.3 (0.9, 5.7) | 3.6 (1.6, 5.6) | 3.9 (2.7, 5.2) | |
| Cefoxitin | 3.3 (1.7, 5.0) | 4.8 (2.8, 6.9) | 4.9 (3.3, 6.5) | 4.2 (1.9, 6.5) | 5.2 (2.3, 8.1) | 4.7 (2.5, 6.9) | 5.5 (4.1, 6.8) | |
| Cefotaxime | 1.8 (0.6, 3.0) | 2.1 (0.7, 3.4) | 2.3 (1.2, 3.4) | 3.8 (1.6, 6.1) | 3.9 (1.4, 6.4) | 3.9 (1.9, 6.0) | 4.0 (2.8, 5.2) | |
| Gentamicin | 3.5 (1.8, 5.2) | 3.5 (1.7, 5.2) | 3.9 (2.4, 5.3) | 4.5 (2.1, 6.9) | 3.4 (1.1, 5.8) | 2.2 (0.7, 3.8) | 4.2 (3.0, 5.4) | |
| Imipenem | 1.0 (0.0, 2.3) | 3.5 (0.7, 6.3) | 3.3 (0.9, 5.7) | 4.0 (0.5, 7.4) | 1.9 (0.0, 4.4) | 3.0 (0.4, 5.7) | 4.2 (2.7, 5.8) | |
| Levofloxacin | 0.7 (0.0, 1.7) | 1.1 (0.0, 2.2) | 0.6 (0.0, 1.3) | 0.6 (0.0, 1.8) | 2.2 (0.0, 4.6) | 2.4 (0.3, 4.5) | 2.8 (1.3, 4.2) | |
| Meropenem | 0.7 (0.0, 1.7) | 3.3 (1.2, 5.4) | 2.7 (1.3, 4.2) | 1.3 (0.0, 3.1) | 3.7 (0.5, 6.9) | 3.4 (0.9, 5.9) | 1.1 (0.1, 2.1) | |
| Piperacillin-tazobactam | 3.6 (1.8, 5.3) | 4.4 (2.4, 6.4) | 2.1 (1.0, 3.2) | 3.1 (1.0, 5.2) | 3.3 (0.9, 5.7) | 5.6 (3.2, 8.1) | 3.9 (2.7, 5.2) | |
| Cotrimoxazole | 3.8 (2.0, 5.6) | 2.3 (0.9, 3.7) | 2.7 (1.5, 4.0) | 4.5 (2.1, 6.9) | 3.9 (1.4, 6.4) | 3.7 (1.7, 5.6) | 4.7 (3.4, 6.0) | |
| Tigecycline | 2.9 (1.3, 4.5) | 5.0 (2.8, 7.1) | 4.3 (2.8, 5.9) | 4.7 (2.2, 7.3) | 5.2 (2.2, 8.2) | 3.5 (1.6, 5.5) | 4.3 (3.0, 5.6) | |
| P. aeruginosa (n=226,141) | Amikacin | 1.6 (1.0, 2.2) | 2.0 (1.5, 2.5) | 2.9 (2.5, 3.3) | 2.8 (2.1, 3.4) | 3.2 (2.3, 4.0) | 3.1 (2.3, 3.9) | 2.5 (1.8, 3.3) |
| Aztreonam | 4.2 (3.3, 5.2) | 5.4 (4.5, 6.2) | 6.6 (6.0, 7.2) | 7.2 (6.2, 8.2) | 8.2 (6.9, 9.5) | 7.1 (5.9, 8.3) | 9.0 (7.7, 10.3) | |
| Ceftazidime | 5.9 (4.8, 7.0) | 5.0 (4.2, 5.8) | 7.0 (6.5, 7.6) | 7.5 (6.5, 8.4) | 8.4 (7.1, 9.7) | 9.0 (7.6, 10.3) | 9.0 (7.7, 10.3) | |
| Ciprofloxacin | 1.6 (1.0, 2.2) | 1.9 (1.4, 2.4) | 1.8 (1.5, 2.1) | 2.3 (1.7, 2.8) | 3.0 (2.1, 3.8) | 3.0 (2.2, 3.9) | 3.7 (2.9, 4.6) | |
| Colistin | 0.0 (0.0, 0.0) | 0.0 (0.0, 0.1) | 0.2 (0.1, 0.2) | 0.3 (0.1, 0.5) | 0.1 (0.0, 0.2) | 0.4 (0.1, 0.6) | 0.1 (0.0, 0.2) | |
| Cefepime | 3.4 (2.5, 4.3) | 4.2 (3.4, 4.9) | 4.7 (4.2, 5.1) | 6.0 (5.2, 6.9) | 6.4 (5.2, 7.6) | 6.6 (5.4, 7.7) | 7.4 (6.2, 8.6) | |
| Gentamicin | 1.2 (0.7, 1.7) | 1.9 (1.4, 2.4) | 2.0 (1.7, 2.4) | 2.1 (1.6, 2.7) | 2.9 (2.0, 3.7) | 3.3 (2.5, 4.2) | 2.8 (2.1, 3.6) | |
| Imipenem | 2.5 (1.7, 3.2) | 3.3 (2.6, 4.0) | 3.9 (3.5, 4.4) | 4.9 (4.1, 5.8) | 6.3 (5.1, 7.5) | 5.4 (4.3, 6.4) | 5.9 (4.8, 7.0) | |
| Levofloxacin | 1.6 (0.9, 2.3) | 1.7 (1.1, 2.2) | 1.7 (1.3, 2.1) | 1.9 (1.3, 2.6) | 3.6 (2.5, 4.7) | 2.6 (1.6, 3.6) | 3.5 (2.4, 4.6) | |
| Meropenem | 2.7 (2.0, 3.5) | 3.3 (2.6, 4.0) | 4.0 (3.6, 4.5) | 4.7 (3.9, 5.4) | 6.2 (5.0, 7.3) | 5.1 (4.0, 6.1) | 6.1 (5.0, 7.3) | |
| Piperacillin | 4.3 (3.3, 5.2) | 4.1 (3.3, 4.8) | 4.5 (4.0, 5.0) | 5.9 (5.0, 6.8) | 6.3 (5.1, 7.5) | 6.5 (5.4, 7.7) | 7.0 (5.8, 8.1) | |
| Piperacillin-tazobactam | 4.6 (3.6, 5.7) | 4.3 (3.5, 5.1) | 5.4 (4.8, 5.9) | 6.4 (5.4, 7.4) | 8.3 (6.9, 9.7) | 7.8 (6.5, 9.1) | 7.6 (6.4, 8.9) | |
| S. aureus (n= 31,284) | Arbekacin | 0.0 (0.0, 0.0) | 0.0 (0.0, 0.0) | 0.0 (0.0, 0.0) | 0.0 (0.0, 0.0) | 0.9 (0.0, 2.6) | 0.0 (0.0, 0.0) | 0.0 (0.0, 0.0) |
| Ciprofloxacin | 0.0 (0.0, 0.0) | 1.8 (0.0, 3.5) | 3.0 (0.8, 5.2) | 1.6 (0.0, 3.9) | 6.0 (1.7, 10.4) | 3.8 (1.2, 6.3) | 2.1 (1.1, 3.1) | |
| Clindamycin | 0.0 (0.0, 0.0) | 2.3 (0.3, 4.3) | 2.2 (0.3, 4.1) | 1.7 (0.0, 3.9) | 3.6 (0.1, 7.0) | 3.3 (0.9, 5.7) | 1.3 (0.5, 2.1) | |
| Erythromycin | 0.0 (0.0, 0.0) | 2.3 (0.3, 4.3) | 2.2 (0.3, 4.0) | 1.7 (0.0, 3.9) | 5.3 (1.2, 9.5) | 3.3 (0.9, 5.7) | 1.5 (0.7, 2.4) | |
| Linezolid | 0.0 (0.0, 0.0) | 0.0 (0.0, 0.0) | 0.0 (0.0, 0.0) | 0.0 (0.0, 0.0) | 0.0 (0.0, 0.0) | 0.0 (0.0, 0.0) | 0.0 (0.0, 0.0) | |
| Mupirocin | 0.5 (0.0, 1.4) | 0.9 (0.0, 2.1) | 1.7 (0.0, 3.4) | 2.4 (0.0, 5.2) | 2.6 (0.0, 5.5) | 0.9 (0.0, 2.2) | 0.5 (0.0, 1.0) | |
| Nitrofurantoin | 0.0 (0.0, 0.0) | 0.0 (0.0, 0.0) | 0.0 (0.0, 0.0) | 0.0 (0.0, 0.0) | 1.1 (0.0, 3.2) | 0.0 (0.0, 0.0) | 0.0 (0.0, 0.0) | |
| Oxacillin | 0.9 (0.0, 2.2) | 1.8 (0.0, 3.6) | 1.8 (0.0, 3.5) | 0.8 (0.0, 2.4) | 7.0 (2.3, 11.7) | 2.8 (0.6, 5.0) | 2.0 (1.0, 3.0) | |
| Penicillin G | 0.0 (0.0, 0.0) | 0.5 (0.0, 1.3) | 0.4 (0.0, 1.3) | 0.0 (0.0, 0.0) | 0.9 (0.0, 2.6) | 0.5 (0.0, 1.4) | 0.6 (0.1, 1.2) | |
| Quinupristin-dalfopristin | 0.0 (0.0, 0.0) | 0.0 (0.0, 0.0) | 0.0 (0.0, 0.0) | 0.0 (0.0, 0.0) | 0.0 (0.0, 0.0) | 0.0 (0.0, 0.0) | 0.0 (0.0, 0.0) | |
| Rifampin | 0.0 (0.0, 0.0) | 0.9 (0.0, 2.7) | 1.0 (0.0, 2.8) | 1.7 (0.0, 5.0) | 0.0 (0.0, 0.0) | 1.0 (0.0, 3.0) | 1.5 (0.3, 2.7) | |
| Cotrimoxazole | 0.0 (0.0, 0.0) | 0.0 (0.0, 0.0) | 0.4 (0.0, 1.3) | 0.0 (0.0, 0.0) | 0.9 (0.0, 2.6) | 0.0 (0.0, 0.0) | 0.8 (0.2, 1.4) | |
| Teicoplanin | 0.0 (0.0, 0.0) | 0.0 (0.0, 0.0) | 0.0 (0.0, 0.0) | 0.0 (0.0, 0.0) | 0.0 (0.0, 0.0) | 0.0 (0.0, 0.0) | 0.0 (0.0, 0.0) | |
| Tetracycline | 0.9 (0.0, 2.2) | 1.3 (0.0, 2.8) | 3.9 (1.4, 6.4) | 4.1 (0.6, 7.6) | 4.3 (0.6, 8.0) | 3.3 (0.9, 5.7) | 1.9 (0.9, 2.8) | |
| Tigecycline | 0.0 (0.0, 0.0) | 0.5 (0.0, 1.3) | 0.0 (0.0, 0.0) | 0.0 (0.0, 0.0) | 0.0 (0.0, 0.0) | 0.0 (0.0, 0.0) | 0.8 (0.2, 1.4) | |
| Telithromycin | 0.5 (0.0, 1.4) | 1.8 (0.0, 3.5) | 3.1 (0.8, 5.3) | 1.6 (0.0, 3.9) | 6.0 (1.7, 10.4) | 4.2 (1.5, 6.9) | 2.4 (1.3, 3.4) | |
| Vancomycin | 0.0 (0.0, 0.0) | 0.0 (0.0, 0.0) | 0.0 (0.0, 0.0) | 0.0 (0.0, 0.0) | 0.0 (0.0, 0.0) | 0.0 (0.0, 0.0) | 0.0 (0.0, 0.0) | |
a) Each successive isolate consist of two microorganisms with the same identification from two different time points. No shade: < 3%; grey shade: 3% to 6%; dark grey shade: >6%.
b) Values represent the proportion (%) of isolates with categorical change; numbers in parentheses indicate the 95% confidence interval (CI).
This study aimed to evaluate the dynamics of antimicrobial susceptibility by analyzing a large dataset of paired and successive bacterial isolates obtained from a single tertiary care center in Korea to determine a reasonable frequency for repeat AST. Our findings provide insights into the stability of antimicrobial susceptibility patterns over time for several common bacterial pathogens, which could help inform local laboratory policies regarding repeat testing.
Our analysis of “paired” isolates demonstrated a high CA for most organisms, including S. aureus, E. faecalis, E. faecium, E. coli, and A. baumannii complex. However, P. aeruginosa exhibited the lowest concordance, even on the same day, indicating a marked variation in MIC. This variability was further highlighted by the substantial differences observed in agreement rates for specific P. aeruginosa—antimicrobial combinations, suggesting potential issues with relying on the AST of a single isolate. For successive isolates, the EMI, CNRR, and combined CNRR+EMI generally increased with longer time intervals (from 1–7 to 31–365 days).
The S. aureus and E. faecalis species demonstrated a low frequency of changes in resistance, with CNRR+EMI rates remaining low even up to 365 days. Similarly, E. faecium exhibited a relatively low CNRR+EMI. These findings are largely consistent with and, in the case of the long-term stability of S. aureus, extend the observations of Sarink et al. [1], who reported a < 10% risk of resistance for S. aureus within 30 days. Our data suggest that this stability persists much longer in a substantial proportion of isolates. Thomson et al. [7] also suggested that repeat testing for S. aureus is not routinely necessary, which aligns with our stability findings.
In contrast, gram-negative bacilli exhibited more pronounced changes over time. For E. coli, the CNRR+EMI increased from 2.4% at 1–7 days to 6.4% at 31–365 days, whereas K. pneumoniae showed a CNRR+EMI of 3.0%, which increased to 9.0% over the longest interval. When considering the upper bound of our 1–7-day interval, these CNRR+EMI rates are broadly comparable to the approximately 10% risk for Enterobacterales within 7 days noted by Sarink et al. [1]. The recommendation by Thomson et al. [7] to retest Enterobacteriaceae after 3 days seems reasonable, given the observed changes in CNRR+EMI rates.
The P. aeruginosa species consistently demonstrated the highest propensity for change, with the lowest EA and CA measured in both paired and successive isolates and the highest EMI rates over time. Moreover, its CNRR+EMI was 4.1% within 1–7 days, which increased to 6.6% at longer intervals. This inherent variability and tendency to acquire resistance in P. aeruginosa have been a consistent theme, supported by Sarink et al. [1], Köck et al. [2], and early work by Thomson et al. [7], all of whom suggest more frequent testing for this pathogen. When examining changes in susceptibility by antibiotic class, β-lactam antibiotics showed more frequent shifts, reflecting higher rates of acquiring resistance. In contrast, colistin exhibited little variation, with minimal changes observed over time.
Our data for A. baumannii complex also showed increasing CNRR+EMI rates over time, highlighting another gram-negative organism that warrants careful consideration for repeat testing. The reasons for these observed changes may be multifactorial, including the selection of preexisting resistant subpopulations, de novo mutations, acquisition of resistance elements, or even the isolation of a new strain, especially over longer periods [11,12].
Focusing on the first 7 days, early antimicrobial susceptibility changes revealed notable differences depending on the pathogen and antibiotic class involved. Although isolates such as E. faecium, S. aureus, and E. coli occasionally crossed the 6% threshold, which represents a statistical doubling of the 3% major error limit defined by the CLSI standards for AST system validation [10], and even the 10% threshold suggested by Sarink et al. [1], their shift in resistance rates remained inconsistent, suggesting that these fluctuations may partly reflect inherent analytical variability rather than stable evolutionary shifts. In contrast, P. aeruginosa exhibited a rapid and sustained progression toward resistance: P. aeruginosa isolates frequently surpassed the 3% analytical noise level as early as day 1 and exceeded the 6% warning threshold by day 3, with resistance levels remaining consistently high thereafter. These findings reinforce the clinical recommendation of more aggressive AST monitoring for P. aeruginosa while suggesting that for species such as E. coli or S. aureus, follow-up AST may be safely deferred within specific intervals unless clinical failure is evident.
Drawing on a large Korean dataset, this study demonstrated that repeat AST frequency should be tailored to specific drug–bacterium combinations and time elapsed rather than following a “one-size-fitsall” approach. Laboratories can optimize resources by extending testing intervals for stable organisms that include S. aureus and E. faecalis, effectively implementing a “less is more” strategy [1]. Conversely, the rapid phenotypic adaptation of P. aeruginosa necessitates high-frequency monitoring and possible same-day testing from multiple critical sites. These findings may assist laboratories in refining repeat AST protocols by providing microbiological data that could support stratification based on microorganisms and, where feasible, initial susceptibility profiles. Although these findings support microorganism-based stratification for AST protocols, the long-term clinical impact of such optimized strategies warrants further validation.
This study has several limitations. Firstly, this study involved a single-center, retrospective analysis. Although the dataset was large, the findings may not be generalizable to other healthcare settings with different patient populations, antibiotic-prescribing practices, or local antimicrobial-resistance epidemiology. Secondly, while the clinical context is widely acknowledged as crucial for determining the necessity of repeat AST, especially in cases of persistent infection or high bacterial burden [3], our study primarily focused on patterns in microbiological data. Consequently, detailed clinical data, such as patient comorbidities, ongoing antimicrobial therapy, specific infection sites, clinical response to treatment, and reasons for repeat culture collection, were not included in our dataset. Thirdly, this study did not involve molecular typing; therefore, discerning whether the observed changes in susceptibility in “successive” isolates were due to the in-vivo evolution of resistance within the same bacterial strain or the acquisition of a new phenotypically similar but genotypically distinct strain was not possible. Furthermore, the reliance on an aggregate dataset lacking patient-level longitudinal tracking serves as a primary limitation, as it hindered our capacity to verify the clinical significance of observed transient spikes and implies that such fluctuations may reflect populationlevel variance rather than the true emergence of resistance within individual hosts.
This study was approved by the Institutional Review Board (4-2020-0465).
Dongeun Yong has been an editorial board member of the Annals of Clinical Microbiology since 2022. However, he was not involved in the review process of this article. No other potential conflicts of interest relevant to this article were reported.
This research was supported by the Bio and Medical Technology Development Program of the National Research Foundation (NRF), funded by the Korean government (MSIT) (No. RS-2023-00219213); a National Research Foundation (NRF) grant funded by the Ministry of Science and ICT (MSIT) of Korea (2022K1A4A8A01080317); and a grant from the Korea Health Technology R&D Project through the Korea Health Industry Development Institute (KHIDI), funded by the Ministry of Health & Welfare, Republic of Korea (HI23C1216).
The datasets generated during the current study are available from the corresponding author upon request.
1. Sarink MJ, Bode LGM, Croughs P, de Steenwinkel JEM, Verkaik NJ, van Westreenen M, et al. Less is more: when to repeat antimicrobial susceptibility testing. J Clin Microbiol 2023;61:e00463-23.


2. Köck R, Schuler F, Idelevich EA, Schaumburg F. Variability of antibiograms: how often do changes in the antimicrobial susceptibility pattern occur in isolates from one patient? Clin Microbiol Infect 2021;27:1638-43.
3. Giltner CL, Kelesidis T, Hindler JA, Bobenchik AM, Humphries RM. Frequency of susceptibility testing for patients with persistent methicillin-resistant Staphylococcus aureus bacteremia. J Clin Microbiol 2014;52:357-61.
4. Bartlett RC. Making optimum use of the microbiology laboratory. III. Aids of antimicrobial therapy. JAMA 1982;247:1868-71.
5. Bartlett RC, Mazens-Sullivan M, Tetreault JZ, Lobel S, Nivard J. Evolving approaches to management of quality in clinical microbiology. Clin Microbiol Rev 1994;7:55-88.
6. Sanders CC and Sanders WE Jr. Emergence of resistance during therapy with the newer betalactam antibiotics: role of inducible beta-lactamases and implications for the future. Rev Infect Dis 1983;5:639-48.
7. Thomson RB Jr, File TM Jr, Burgoon RA. Repeat antimicrobial susceptibility testing of identical isolates. J Clin Microbiol 1989;27:1108-11.
8. EUCAST web site on clinical breakpoints and dosing of antibiotics. Clinical breakpoints – breakpoints and guidance. https://www.eucast.org/clinical_breakpoints/ [Online] (last visited on 6 August 2025).
9. Cressman AM, MacFadden DR, Verma AA, Razak F, Daneman N. Empiric antibiotic treatment thresholds for serious bacterial infections: a scenario-based survey study. Clin Infect Dis 2019;69:930-7.
10. CLSI. Performance standards for antimicrobial susceptibility testing. Wayne, PA: Clinical and Laboratory Standards Institute; 2025.
11. Lupo A, Haenni M, Madec JY. Antimicrobial resistance in Acinetobacter spp. and Pseudomonas spp. Microbiol Spectr 2018;6:10-1128.
12. Sheehan DJ, Janda JM, Bottone EJ. Pseudomonas aeruginosa: changes in antibiotic susceptibility, enzymatic activity, and antigenicity among colonial morphotypes. J Clin Microbiol 1982;15:926-30.
1. Sarink MJ, Bode LGM, Croughs P, de Steenwinkel JEM, Verkaik NJ, van Westreenen M, et al. Less is more: when to repeat antimicrobial susceptibility testing. J Clin Microbiol 2023;61:e00463-23.
2. Köck R, Schuler F, Idelevich EA, Schaumburg F. Variability of antibiograms: how often do changes in the antimicrobial susceptibility pattern occur in isolates from one patient? Clin Microbiol Infect 2021;27:1638-43.
3. Giltner CL, Kelesidis T, Hindler JA, Bobenchik AM, Humphries RM. Frequency of susceptibility testing for patients with persistent methicillin-resistant Staphylococcus aureus bacteremia. J Clin Microbiol 2014;52:357-61.
4. Bartlett RC. Making optimum use of the microbiology laboratory. III. Aids of antimicrobial therapy. JAMA 1982;247:1868-71.
5. Bartlett RC, Mazens-Sullivan M, Tetreault JZ, Lobel S, Nivard J. Evolving approaches to management of quality in clinical microbiology. Clin Microbiol Rev 1994;7:55-88.
6. Sanders CC and Sanders WE Jr. Emergence of resistance during therapy with the newer betalactam antibiotics: role of inducible beta-lactamases and implications for the future. Rev Infect Dis 1983;5:639-48.
7. Thomson RB Jr, File TM Jr, Burgoon RA. Repeat antimicrobial susceptibility testing of identical isolates. J Clin Microbiol 1989;27:1108-11.
8. EUCAST web site on clinical breakpoints and dosing of antibiotics. Clinical breakpoints – breakpoints and guidance. https://www.eucast.org/clinical_breakpoints/ [Online] (last visited on 6 August 2025).
9. Cressman AM, MacFadden DR, Verma AA, Razak F, Daneman N. Empiric antibiotic treatment thresholds for serious bacterial infections: a scenario-based survey study. Clin Infect Dis 2019;69:930-7.
10. CLSI. Performance standards for antimicrobial susceptibility testing. Wayne, PA: Clinical and Laboratory Standards Institute; 2025.
11. Lupo A, Haenni M, Madec JY. Antimicrobial resistance in Acinetobacter spp. and Pseudomonas spp. Microbiol Spectr 2018;6:10-1128.
12. Sheehan DJ, Janda JM, Bottone EJ. Pseudomonas aeruginosa: changes in antibiotic susceptibility, enzymatic activity, and antigenicity among colonial morphotypes. J Clin Microbiol 1982;15:926-30.