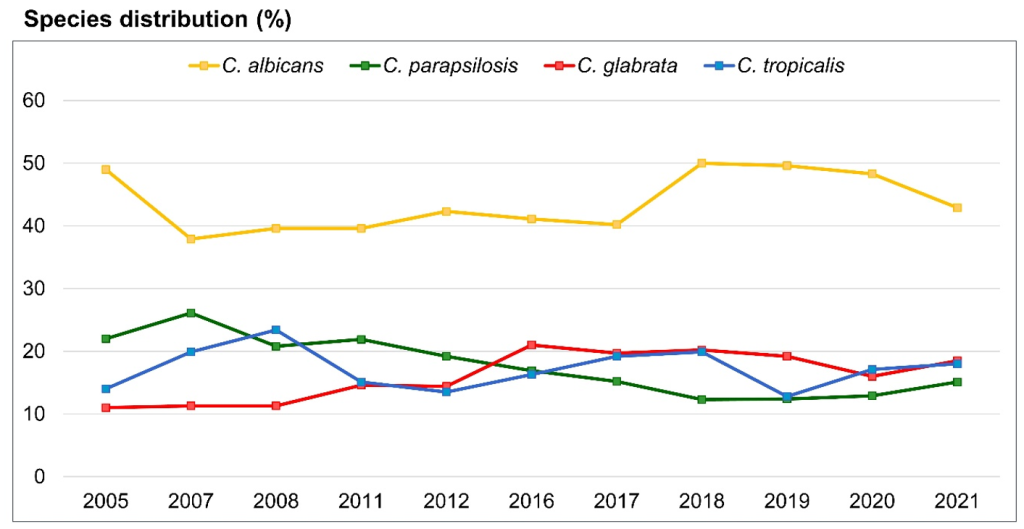
Fig. 1. Species distribution of the Candida bloodstream infection isolates from Korean hospitals.
Ann Clin Microbiol 2024;27(4):231-244. Candida and candidemia in Korea Download image
Table 1. Key approaches in the polyphasic fungal identification
Ann Clin Microbiol 2024;27(4):221-230. Fungal identification based on the polyphasic approach: a clinical practice guideline Download table Categories Contents Phenotypic-based approach Morphological characteristics – Sporulation organ structures (e.g., conidia, macroconidia).– Colony traits: growth rate, aerial mycelium, odor.– Cultivation conditions (e.g., medium composition, temperature).– Microscopy: with/without staining, DIC microscopy. Biochemical and physiological characteristics […]
Fungal infections: rising threats, diagnostic challenges, and the path forward for clinical microbiology laboratories
Editorial Jayoung Kim Department of Laboratory Medicine, International St. Mary’s Hospital, College of Medicine, Catholic Kwandong University, Incheon, Korea Corresponding to Jayoung Kim, E-mail: lmkjy7@gmail.com Ann Clin Microbiol 2024;27(4):217-219. https://doi.org/10.5145/ACM.2024.27.4.1Received on 17 December 2024, Revised on 19 December 2024, Accepted on 19 December 2024, Published on 20 December 2024.Copyright © Korean Society of Clinical Microbiology.This […]
Fungal identification based on the polyphasic approach: a clinical practice guideline
Review article Jayoung Kim Department of Laboratory Medicine, International St. Mary’s Hospital, College of Medicine, Catholic Kwandong University, Incheon, Korea Corresponding to Jayoung Kim, E-mail: lmkjy7@gmail.com Ann Clin Microbiol 2024;27(4):221-230. https://doi.org/10.5145/ACM.2024.27.4.2Received on 18 November 2024, Revised on 10 December 2024, Accepted on 10 December 2024, Published on 20 December 2024.Copyright © Korean Society of Clinical […]
Candida and candidemia in Korea
Review article Yong Jun Kwon, Jong Hee Shin Department of Laboratory Medicine, Chonnam National University Medical School, Gwangju, Korea Corresponding to Jong Hee Shin, E-mail: shinjh@chonnam.ac.kr Ann Clin Microbiol 2024;27(4):231-244. https://doi.org/10.5145/ACM.2024.27.4.3Received on 9 October 2024, Revised on 27 November 2024, Accepted on 29 November 2024, Published on 20 December 2024.Copyright © Korean Society of Clinical […]
Current nonculture-based diagnosis of candidemia
Review article Eun Jeong Won Department of Laboratory Medicine, Asan Medical Center, University of Ulsan College of Medicine, Seoul, Korea Corresponding to Eun Jeong Won, E-mail: ejwon@amc.seoul.kr Ann Clin Microbiol 2024;27(4):245-255. https://doi.org/10.5145/ACM.2024.27.4.4Received on 1 September 2024, Revised on 4 November 2024, Accepted on 14 November 2024, Published on 16 December 2024.Copyright © Korean Society of Clinical […]
Fig. 2. Matrix-assisted laser desorption/ionization time-of-flight mass spectrometry Prototheca wickerhamii spectrum. (A) Spectrum of P. wickerhamii after yeast sample preparation with formic acid showing ambiguous identification. (B) Spectrum of P. wickerhamii after mold sample preparation using ethanol/formic acid extraction.
Ann Clin Microbiol 2024;27(4):271-277. Cutaneous infection caused by Prototheca wickerhamii identified using VITEK MS following pretreatment with a mold-extraction protocol: a case report Download image
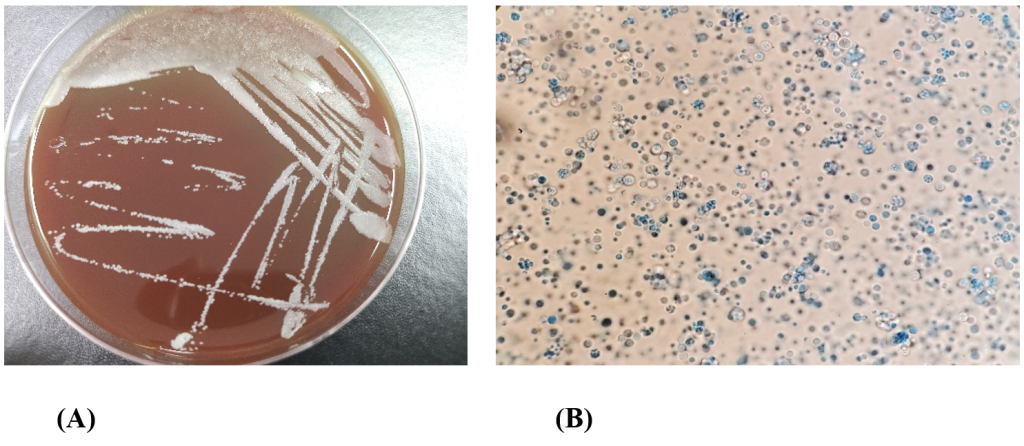
Fig. 1. Colony and microscopic morphology of Prototheca wickerhamii. (A) White dry colonies on BAP after 24 hours of incubation at 35℃ with 5% CO2. (B) Lactophenol cotton blue stain of P. wickerhamii showing endospore and sporangia features (oil immersion, × 1000 magnification). BAP, blood agar plate.
Ann Clin Microbiol 2024;27(4):271-277. Cutaneous infection caused by Prototheca wickerhamii identified using VITEK MS following pretreatment with a mold-extraction protocol: a case report Download image
Table 1. Clinical summary of P. wickerhamii reported cases in South Korea
Ann Clin Microbiol 2024;27(4):271-277. Cutaneous infection caused by Prototheca wickerhamii identified using VITEK MS following pretreatment with a mold-extraction protocol: a case report Download table Study Age/sex Year Underlying Diagnosis Location Yang et al. [12] 80/F 1996 – VITEK YBC Forearm Kim et al. [13] 55/F 1996 Intralesional steroid injection API20C Ankle Kim et al. […]
Cutaneous infection caused by Prototheca wickerhamii identified using VITEK MS following pretreatment with a mold-extraction protocol: a case report
Case report Dong Heon Shin, Joon Kim, Wee Gyo Lee Departments of Laboratory Medicine, Ajou University School of Medicine, Suwon, Korea Corresponding to Wee Gyo Lee, E-mail: weegyo@ajou.ac.kr Ann Clin Microbiol 2024;27(4):271-277. https://doi.org/10.5145/ACM.2024.27.4.7Received on 2 October 2024, Revised on 3 November 2024, Accepted on 11 November 2024, Published on 3 December 2024.Copyright © Korean Society […]