
Younjee Hwang1,2*, Ju Yeong Kim1,3*, Se Il Kim4,5, Ji Yeon Sung1,6, Hye Su Moon1, Tai-Soon Yong3, Ki Ho Hong1, Hyukmin Lee1![]() , Dongeun Yong1
, Dongeun Yong1![]()
1Department of Laboratory Medicine and Research Institute of Bacterial Resistance, Yonsei University College of Medicine, Seoul, Korea
2Brain Korea 21 PLUS Project for Medical Science, Yonsei University College of Medicine, Seoul, Korea
3Department of Tropical Medicine, Institute of Tropical Medicine and Arthropods of Medical Importance Resource Bank, Yonsei University College of Medicine, Seoul, Korea
4Division of Chemical and Medical Metrology, Center for Bioanalysis, Korea Research Institute of Standards and Science, Daejeon, Korea
5Convergent Research Center for Emerging Virus Infection, Korea Research Institute of Chemical Technology, Daejeon, Korea
6Roche Diagnostics Korea, Seoul, Korea
*These authors contributed equally to this work.
Correspondence to Dongeun Yong, E-mail: deyong@yuhs.ac
Ann Clin Microbiol 2025;28(1):3. https://doi.org/10.5145/ACM.2025.28.1.3
Received on 31 December 2024, Revised on 6 March 2025, Accepted on 10 March 2025, Published on 20 March 2025.
Copyright © Korean Society of Clinical Microbiology.
This is an Open Access article which is freely available under the Creative Commons Attribution-NonCommercial-NoDerivatives 4.0 International License (CC BY-NC-ND) (https://creativecommons.org/licenses/by-nc-nd/4.0/).

Background: The 16S rRNA-targeted next-generation sequencing (NGS) has been widely used as the primary tool for microbiome analysis. However, whether the sequenced microbial diversity absolutely represents the original sample composition remains unclear. This study aimed to evaluate whether 16S rRNA gene-targeted NGS accurately captures bacterial community composition.
Methods: Mock communities were constructed using equal amounts of DNA from 18 bacterial strains in three formats: genomic DNA, recombinant plasmids, and polymerase chain reaction (PCR) templates. The V3V4 region of the 16S rRNA gene was amplified and sequenced using the Illumina MiSeq.
Results: Data regression analysis revealed that the recombinant plasmid produced more accurate and precise correlation curve than that by the gDNA and PCR products, with a slope closest to 1 (1.0082) and the highest R² value (0.9975). Despite the same input amount of bacterial DNA, the NGS read distribution varied across all three mock communities. Using multiple regression analysis, we found that the guanine-cytosine (GC) content of the V3V4 region, 16S rRNA gene, size of gDNA, and copy number of 16S rRNA were significantly associated with the NGS output of each bacterial species.
Conclusion: This study demonstrated that recombinant plasmids are the preferred option for quality control and that NGS output is biased owing to certain bacterial characteristics, such as %GC content, gDNA size, and 16S rRNA gene copy number. Further research is required to develop a system that compensates for NGS process biases using mock communities.
Mock community, High-throughput nucleotide sequencing, Illumina MiSeq, GC content, 16S rRNA gene copy number
Over time, high-throughput sequencing technologies, also known as next-generation sequencing (NGS), have rapidly developed. These techniques have changed the view of metagenomics, which was previously studied using traditional methods, such as cultivating microbes [1–3]. Among these, sequencing of the 16S rRNA gene is one of the widely practiced microbiome research methods because the nine variable regions of the 16S rRNA gene are ideal targets for phylogenetic studies to characterize microbial communities [4].
Despite advancements in sequencing platforms, the basic questions still remain: whether the enormous amounts of data generated from deep sequencing truly reflect microbial composition and whether any reliable solution is available [5,6]. In addition, microbiome research using NGS tends to ignore the fact that this method is not standardized and has no quality control [3]. Several biases may occur along the experimental processes such as DNA extraction [7] and polymerase chain reaction (PCR) amplification. Depending on the NGS platform, software, and database used to analyze the raw data, it might cause inconsistencies in analytical results [8]. However, to date, no explicit standard protocol exists for identifying the suitable 16S rRNA hypervariable region [3].
Maintaining the accuracy and reliability of PCR-based and NGS-based microbial analyses necessitates rigorous quality control measures. This study aimed to evaluate the effect of DNA template type (genomic DNA [gDNA], recombinant plasmid, and PCR product) on the accuracy and bias of NGS results by analyzing proportional input-output relationships. As each DNA template type exhibits distinct characteristics that can influence the quantification accuracy, their respective impacts on NGS outcomes must be crucially evaluated.
Previous research has compared various 16S rRNA hypervariable regions and NGS platforms using gDNA-based and mock microbial communities. However, the factors that affect NGS outcomes remain largely unexplored. In this study, we compared three mock communities (gDNA, 16S rRNA gene-cloned plasmid, and PCR products) to demonstrate their influence on the results using the Illumina MiSeq platform. Additionally, we have discussed the possibility of using the mock community as a standardizer during 16S rRNA gene-targeted high-throughput sequencing and generated a formula that can be used to predict the accurate representation of microbial composition.
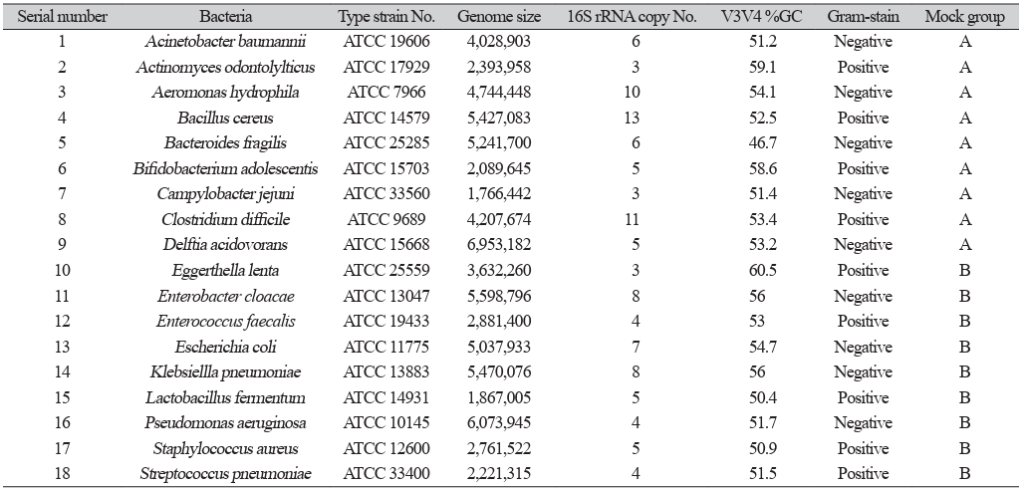
A total of 18 bacterial type strains known as commensal bacteria in humans were selected randomly from American Type Culture Collection (Table 1). These include nine gram-positive and nine gram-negative bacteria to ensure a diverse distribution of V3V4 %GC content. They were cultured in appropriate growth media according to their requirements. Facultative anaerobic strains were cultured on blood agar plates (BAP; Asan Pharmaceutical) at 37°C for 24 h. Obligate anaerobes were cultured on brucella agar plates (Asan Pharmaceutical) at 37°C for 48 h with 85% nitrogen, 10% hydrogen, and 5% carbon dioxide gases using the anaerobic chamber Forma 1029 (Thermo Fisher Scientific). C. jejuni was cultured on BAP in microaerophilic conditions and incubated at 40ºC for 48 h. L. fermentum, which is a facultative anaerobe, was cultured on MRS agar (BD) at 37ºC for 24 h in a 5% CO2 incubator.
All bacterial cultures were identified before using matrix-assisted laser desorption/ionization time-of-flight mass spectrometry (MALDI-TOF MS; Bruker Daltonics) and 16S rRNA gene amplification PCR, followed by subsequent Sanger sequencing. To identify the bacterial species with MALDI-TOF MS, one bacterial colony was picked with an autoclaved loop and spread on one spot of the MALDI-TOF MS plate and 1 μL of 70% formic acid was dropped where the bacteria were spread. After formic acid dried, 1 μL of matrix (alpha-cyano-4-hydroxycinnamic acid; Sigma) was dropped on the same spot and after it completely dried, the plate was inserted in the instrument to identify the bacteria. Species identification followed the manufacturer’s guidelines with a cutoff score of ≥ 2.0.
Another method for identifying bacteria was 16S rRNA gene amplification using PCR. Takara Taq kit (Takara Bio Inc.) was used for amplification in a total volume of 50 μL consisting of 0.25 μL Takara Taq DNA polymerase, 5 μL 10× PCR buffer, 4 μL deoxynucleotide (dNTP) mixture, 2 μL of each primer (10 μM), 1 μL of bacterial DNA, and PCR-grade water. PCR cycling conditions were as follows: 95ºC for 5 min, followed by 30 cycles of 1 min of 95ºC, 30 s of 55ºC and 40 s of 72ºC followed by 10 min of 72ºC. PCR products were purified with the QIAquick PCR purification kit (Qiagen) as per the protocol and 35 μL was eluted. The purified PCR products were sequenced using Sanger sequencing and identified using the EzTaxon database on the EzBioCloud website (ChunLab; https://help.ezbiocloud.net/about-chunlab/) and MM18-A Clinical and Laboratory Standards Institute guidelines [9].
To generate mock communities, gDNAs from 18 bacteria were extracted with the GenEluteTM Bacterial Genomic DNA kit (Sigma) with the gram-positive bacterial DNA extraction protocol, in addition to 20 μL of RNase A during the lysis step and the third wash step. During all the washing steps, the columns were incubated for 5 min before centrifugation. The DNA was eluted with 200 μL of EB buffer (Qiagen). Extracted gDNA was purified with Genomic DNA Clean & ConcentratorTM-25 (Zymo Research) with the additional 20 μL RNase A treatment and eluted with 120 μL EB buffer (Qiagen). Purified gDNA was run on a 1% agarose gel with a 1 kb ladder to verify DNA degradation status. To confirm its quantity and quality, gDNA was measured using a fluorometer (Quantus). The 18 bacterial gDNA samples were verified for RNA contamination by capillary electrophoresis using a 7100 CE System (Agilent Technologies).
For recombinant plasmid and PCR mock, the 16S rRNA gene was obtained by PCR using universal primers 27F and 1492R, and the reagent mixture was as follows: a total volume of 50 μL consisting of 0.25μL Takara Taq DNA polymerase, 5 μL 10× PCR buffer, 4 μL dNTP mixture, 2 μL of each primer (10 μM), 1 μL of bacterial DNA, and PCR-grade water. PCR amplification conditions were 95ºC for 5 min, followed by 30 cycles of 1 min of 95ºC, 30 s of 55ºC, and 40 s of 72ºC followed by 10 min of 72ºC and held at 4ºC. The amplified products were purified using a PCR purification kit (Qiagen) according to the protocol and purified products were eluted using 35 μL EB buffer. Purified PCR products were used as PCR mock communities. PCR products were run on 1% agarose gel to confirm a single band at 1,500 bp.
Cloning was performed using the TOPcloner PCR cloning kit (Enzynomics), with the purified 16S rRNA gene amplicon products as inserts and DH5-alpha cells as competent cells for transformation. To confirm the insertion of the 16S rRNA gene into the vector, colonies were obtained for amplification and subcultured on kanamycin (50 μg/mL) added LB broth for plasmid extraction. Plasmids were purified using the QIAprep Miniprep kit (Qiagen) with 35 μL EB buffer for elution and stored at -20ºC until use as a recombinant plasmid mock community. Cloned plasmids were separated on 1% agarose gel to confirm quality.
For all three types of mock communities (gDNA, recombinant plasmid, and PCR mock), each bacterial product (10 μL) was diluted to 20 ng/μL and combined into a single tube. To assess the effect of the input quantity on NGS, the 18 bacterial species were divided into two groups (A and B) in alphabetical order (Table 1, Fig. 1). These groups were mixed in ratios of 1:1, 1:2, 1:4, 1:10, and 1:100 to create five staggered mock samples. The chosen dilution ratios enabled systematic evaluation of how well NGS reflected bacterial input across a wide dynamic range, including both moderate (1:2 and 1:4) and extreme (1:10 and 1:100) dilution conditions. This approach helped to identify potential biases related to template concentration, particularly in gDNA-, plasmid-, and PCR-based mock communities.
Table 1. List of bacterial strains forming mock communities
| Serial number | Bacteria | Type strain No. | Genome size | 16S rRNA copy No. | V3V4 %GC | Gram-stain | Mock group |
|---|---|---|---|---|---|---|---|
| 1 | Acinetobacter baumannii | ATCC 19606 | 4,028,903 | 6 | 51.2 | Negative | A |
| 2 | Actinomyces odontolyticus | ATCC 17929 | 2,393,958 | 3 | 59.1 | Positive | A |
| 3 | Aeromonas hydrophila | ATCC 7966 | 4,744,448 | 10 | 54.1 | Negative | A |
| 4 | Bacillus cereus | ATCC 14579 | 5,427,083 | 13 | 52.5 | Positive | A |
| 5 | Bacteroides fragilis | ATCC 25285 | 5,241,700 | 6 | 46.7 | Negative | A |
| 6 | Bifidobacterium adolescentis | ATCC 15703 | 2,089,645 | 5 | 58.6 | Positive | A |
| 7 | Campylobacter jejuni | ATCC 33560 | 1,766,442 | 3 | 30.5 | Negative | A |
| 8 | Clostridium difficile | ATCC 9689 | 4,207,674 | 11 | 53.4 | Positive | A |
| 9 | Delftia acidovorans | ATCC 15668 | 6,953,182 | 3 | 66.1 | Negative | B |
| 10 | Eggerthella lenta | ATCC 25559 | 3,632,260 | 6 | 60.5 | Positive | B |
| 11 | Enterobacter cloacae | ATCC 13047 | 5,598,796 | 8 | 56 | Negative | B |
| 12 | Enterococcus faecalis | ATCC 19433 | 2,881,400 | 3 | 37 | Positive | B |
| 13 | Escherichia coli | ATCC 11775 | 5,037,886 | 7 | 54.7 | Negative | B |
| 14 | Klebsiella pneumoniae | ATCC 13883 | 5,470,076 | 9 | 57.2 | Negative | B |
| 15 | Lactobacillus fermentum | ATCC 14931 | 1,867,005 | 3 | 50.1 | Positive | B |
| 16 | Pseudomonas aeruginosa | ATCC 10145 | 6,073,945 | 4 | 66.2 | Negative | B |
| 17 | Staphylococcus aureus | ATCC 12600 | 2,761,522 | 5 | 50.9 | Positive | B |
| 18 | Streptococcus pneumoniae | ATCC 33400 | 2,221,315 | 4 | 51.5 | Positive | B |
Abbreviation: ATCC, American Type Culture Collection.
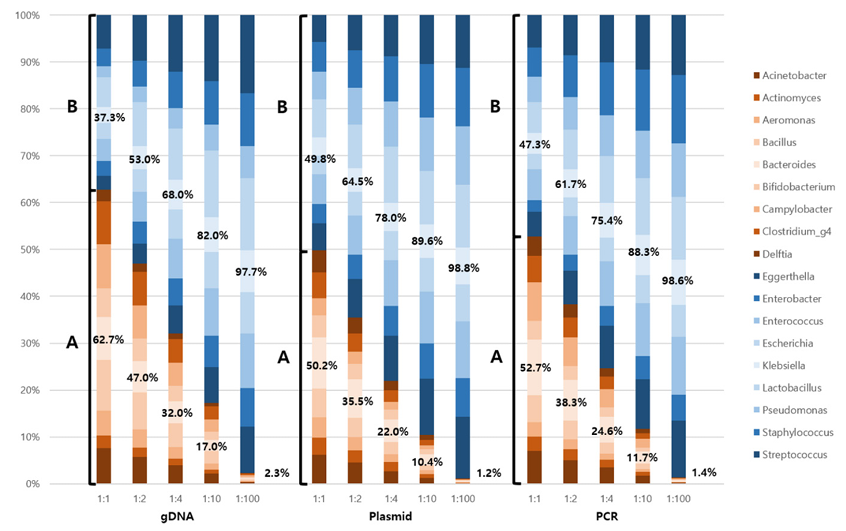
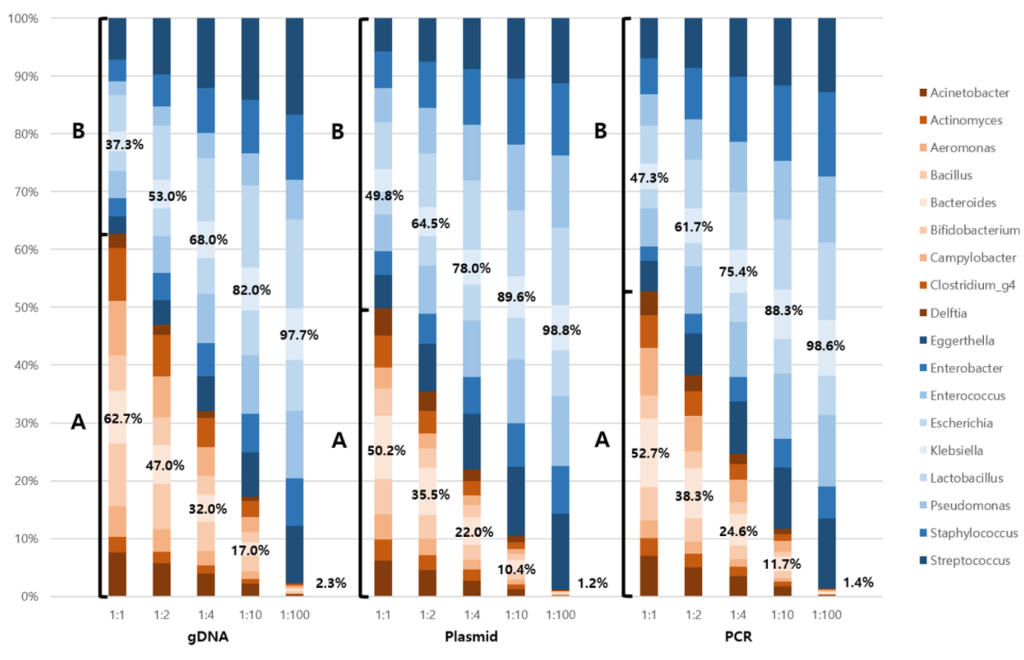
Fig. 1. Effect of quantitative change in input to NGS output. All three types of mock communities were prepared with different input ratios of A and B (1:1, 1:2, 1:4, 1:10, and 1:100) to systematically assess the quantitative reflection of bacterial input in NGS output. Group A is presented in orange and group B is presented in blue. The regression equation for gDNA is represented as y = 1.2259x – 26.705 with a coefficient of determination (R²) of 0.9854. The regression equations for plasmid DNA and PCR product are ‘y = 1.0082x – 1.6091 with an R² value of 0.9975’ and ‘y = 1.054x – 7.0206 with an R² value of 0.9939’, respectively. NGS, next-generation sequencing; gDNA, genomic DNA; PCR, polymerase chain reaction.
The PCR primers used to amplify the 16S rRNA gene were confirmed using Geneious R9.1 in silico. The target regions were selected by previous studies and primers for V3V4 (V3V4 Forward (5′ – 3′), TCG TCG GCA GCG TCA GAT GTG TAT AAG AGA CAG CCT ACG GGN GGC WGC AG; V3V4 Reverse (5′ – 3′), GTC TCG TGG GCT CGG AGA TGT GTA TAA GAG ACA GGA CTA CHV GGG TAT CTA ATC C) [10].
Three types of mock communities were sequenced using an Illumina MiSeq in duplicate with a blank PCR sample. The mock communities were prepared as libraries using the Illumina 16S Metagenomic Sequencing Library Preparation guide [11]. The Illumina protocol recommends a DNA concentration of at least 10–50 ng/μL. A total of 25 μL reaction mix containing 12 μL of 2× KAPA HiFi HotStart ReadyMix (Roche), 5 μL of each overhang adapter added primers (1 μM), and 3 μL of sample DNA was used for amplicon PCR. For index PCR, a total of 50 μL of reaction mixture containing 25 μL of 2× KAPA HiFi HotStart ReadyMix (Roche), 5 μL of each index primer from Nextera XT Index kit (Illumina), 5 μL of amplicon PCR product, and 10 μL of PCR grade water was used. After each PCR, the PCR products were purified using Agencourt AMPure XP beads (Beckman Coulter). The amplified and purified samples were normalized to 4 nM and pooled into one tube. Library and PhiX Control v3 kit (Illumina) were denatured and diluted each to 6 pM and 12.5 pM, and the final PhiX control ratio was 25%. The library was sequenced using the V3 600 cycle kit (Illumina) on the Illumina MiSeq sequencer.
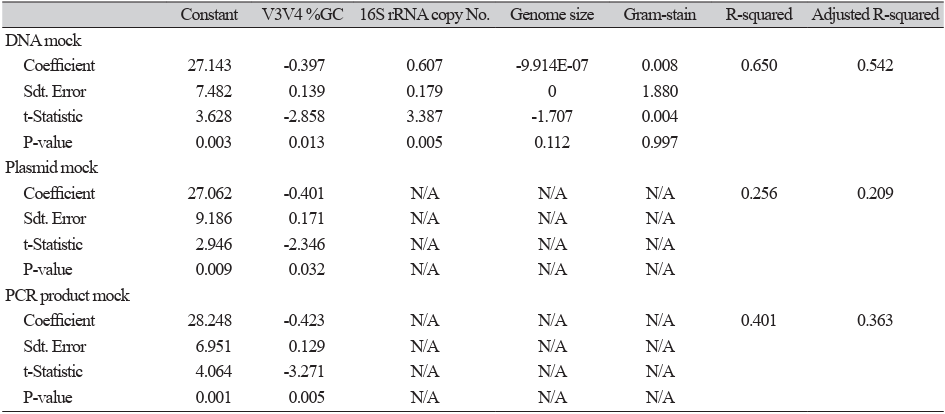
Data from three mock communities sequenced with V3V4 primers were processed using Mothur v1.39 and standard protocol, and paired reads were assembled and aligned to the SILVA 16S rRNA reference alignment, and chimera removal was performed using VSEARCH [12]. Taxonomic classification of the remaining valid sequences was performed using the Ribosomal Database Project (RDP) Classifier v9 [13]. A standard protocol from the BIOiPLUG tutorial [14] was used to align the trimmed sequences to the EzTaxon alignment and classify them into the EzTaxon ID taxonomy. Pre-clustering of unique sequences was filtered to a 2 bp difference, and chimeras were removed using UCHIME. Because characteristics, such as 16S rRNA gene copy number, genome size, guanine-cytosine (GC) content of the V3V4 region sequence, and gramstain positivity of each bacterium can only be encountered for gDNA, only the gDNA mock community was considered for this analysis (Table 2). Correlations between the actual output of the gDNA mock community amplified in the V3V4 region and the characteristics were analyzed by a multiple regression model using SPSS Statistics v23 (IBM).
Table 2. Results of multiple regression analysis of mock communities
| Constant | V3V4 %GC | 16S rRNA copy No. | Genome size | Gram-stain | R-squared | Adjusted R-squared | |
|---|---|---|---|---|---|---|---|
| DNA mock | |||||||
| Coefficient | 27.143 | -0.397 | 0.607 | -9.914E-07 | 0.008 | 0.650 | 0.542 |
| Standard error | 7.482 | 0.139 | 0.179 | 0 | 1.880 | ||
| t-Statistic | 3.628 | -2.858 | 3.387 | -1.707 | 0.004 | ||
| P-value | 0.003 | 0.013 | 0.005 | 0.112 | 0.997 | ||
| Plasmid mock | |||||||
| Coefficient | 27.062 | -0.401 | N/A | N/A | N/A | 0.256 | 0.209 |
| Standard error | 9.186 | 0.171 | N/A | N/A | N/A | ||
| t-Statistic | 2.946 | -2.346 | N/A | N/A | N/A | ||
| P-value | 0.009 | 0.032 | N/A | N/A | N/A | ||
| PCR product mock | |||||||
| Coefficient | 28.248 | -0.423 | N/A | N/A | N/A | 0.401 | 0.363 |
| Standard error | 6.951 | 0.129 | N/A | N/A | N/A | ||
| t-Statistic | 4.064 | -3.271 | N/A | N/A | N/A | ||
| P-value | 0.001 | 0.005 | N/A | N/A | N/A | ||
Abbreviations: PCR, polymerase chain reaction; N/A, not applicable.
The concentration of all 18 bacterial gDNA, recombinant plasmid, and PCR products was measured by the fluorometric quantification method and all exceeded 30 ng/μL. Pure bacterial gDNA without RNA contamination was confirmed by capillary electrophoresis. No-template control samples sequenced using the primers generated fewer than 500 reads. Mock communities sequenced with the V3V4 primers had the highest read counts, with an average of 106,807 reads.
All three mock communities presented quantitatively diluted proportions at different ratios (Fig. 1). The gDNA mock communities at a 1:1 ratio presented 62.7% and 37.3% in groups A and B, respectively. Recombinant plasmid mock and PCR mock presented 50.2% and 49.8%, 52.7% and 47.3% of groups A and B for a 1:1 ratio.
All three mock communities presented quantitatively diluted proportions at different ratios (Fig. 1). The gDNA mock communities at a 1:1 ratio presented 62.7% and 37.3% in groups A and B, respectively. Recombinant plasmid mock and PCR mock presented 50.2% and 49.8%, 52.7% and 47.3% of groups A and B for a 1:1 ratio.
The regression equation for the recombinant plasmid is y = 1.0082x–1.6091, with an R² value of 0.9975. The slope of 1.0082 was remarkably close to the ideal value of 1.0, indicating near-perfect correspondence between expected and measured values, with only a minimal overestimation of 0.82%. This exceptional slope alignment suggests that the recombinant plasmid provided highly accurate quantification across the entire concentration range. The R² of 0.9975 was the highest among the three templates, demonstrating superior precision and linearity of the standard curve relationship.
The regression equation for the PCR product was y = 1.054x – 7.0206 with an R² value of 0.9939. A slope of 1.054 indicated a moderate overestimation of approximately 5.4% compared to expected values, positioning PCR product between gDNA and recombinant plasmid in terms of accuracy. Although this overestimation was smaller than that for gDNA, it represented a systematic bias in quantification. The R² value of 0.9939, which was excellent and indicated good precision, fell between the values for gDNA and the recombinant plasmid.
To determine which characteristics affected the NGS output, multiple regression was performed using independent variables, such as 16S rRNA gene copy number, genome size, GC content of the V3V4 region sequence, and Gram-stain positivity of each bacterium (Table 2). The output of the gDNA mock community was positively correlated with the 16S rRNA gene copy number (p = 0.003) and genome size (p = 0.062) and negatively correlated with the V3V4 sequence GC content (p = 0.006), but it was not associated with grampositive bacteria (p = 0.857). The recombinant plasmid and 16S rRNA gene amplicon mock communities also showed a similar effect of GC content on NGS output (p = 0.018 and p = 0.001, respectively). In the multiple regression model of the gDNA mock, the independent variables explained the dependent variable (R² = 0.702, adjusted R² = 0.578), which means that this model might be applied to compensate for the bias generated from 16S rRNA-targeted NGS. The model formula was as follows:
Bacterial abundance after NGS (%) = 19.785 + (0.572 × Input) + (-0.467 × %GC content of V3V4 sequence) + (0.628 × 16S copy number) + (-1.175 × 10⁻⁶ × genome size) + (-0.335 × gram stain), if gram-positive 1 (otherwise 0) is to be for gram stain.
Mock communities with V3V4 primers averaged 106,807 reads. For 1:1 ratio mocks, gDNA showed 62.7% (A) and 37.3% (B), while plasmids and PCR were near 50%. Regression showed gDNA overestimated by 22.59% (R² = 0.9854), plasmids were near-ideal (slope = 1.0082, R² = 0.9975), and PCR overestimated by 5.4% (R² = 0.9939). NGS output correlated with 16S rRNA copy number (p = 0.003) and genome size (p = 0.062), negatively with GC content (p = 0.006), explaining 70.2% of gDNA mock variance (R² = 0.702). Plasmid and PCR mocks showed similar GC effects (p = 0.018, p = 0.001).
When performing 16S rRNA gene-targeted NGS on the microbiome, it is not possible to accurately reflect the accurate representation of microbial composition due to bias in the process of various steps. This study also presented a bias during the process, in which the amounts of 18 types of bacterial DNA input and the sequenced output resulted in different ratios. Different input quantities of bacteria were displayed proportionally after sequencing, with minute input being unable to exceed the cutoff value. The key factor of high-throughput sequencing was revealed to be the %GC content of the targeted bacterial 16S rRNA gene regions and the 16S rRNA gene copy number, which had a significant effect on the sequenced output. The application of this formula to predict the microbiome of the original sample resulted in a fair trial with minor mismatches in a few bacterial strains of the mock community.
To reduce this bias, we first examined the variable regions of the 16S rRNA gene (data not shown). In this study, the V3V4 region-targeted results exhibited the closest distance to what was expected. Unfortunately, Eggerthella lenta was insignificant in classification by V1V2 primers, as in a previous study [15]. However, all 18 bacteria were detected using the V3V4 and V6V8 primers. Between the two primer sets, the V3V4 primers presented an even distribution for each bacterial read count and had the smallest variance in bacterial abundance. This result is consistent with previous studies that reported that the V4 region was the best primer set to accurately represent the microbial composition [1].
In this study, we demonstrated that 16S rRNA gene-targeted NGS of microbiomes reflected quantitative changes considerably well. Input quantity as a factor influencing NGS should be considered in microbiome studies because it indicates that changes in bacterial mass by any form of experimental treatment can be used to quantitatively compare outputs. In line with our findings, one previous study reported that 16S rRNA gene-targeted NGS better captured temporal shifts in community diversity than whole-community shotgun metagenomic approaches, even with lower sensitivity [10]. Moreover, to explore the microbiota of samples with low biomass, such as skin, urine, or blood, is challenging [16]. Consistent with this study, our data proved that a low quantity of bacteria, comprising less than 0.5% of the sample, was difficult to detect after NGS. When developing microbiome studies using samples with few bacterial inputs, standardization to confirm the appropriate input quantity is essential to avoid misinterpretations.
As shown in Fig. 1, the resulting proportions were analyzed by varying the ratios of groups A to B as 1:1, 1:2, 1:4, 1:10, and 1:100. Different DNA template types have unique characteristics, with their own advantages and disadvantages. This study included three types of DNA templates: gDNA, recombinant plasmids, and PCR products.
Plasmid DNA is a recombinant DNA molecule that includes a target sequence and is the most widely used standard in PCR. It is relatively easy to produce, highly stable, and capable of generating reproducible standard curves, even after long-term storage. PCR products can also serve as templates. The exact copies of the target sequence can be used for precise DNA quantification. However, potential issues, such as contamination and nonspecific amplification during PCR, may affect the outcome.
The slope of the linear regression equation represents the ratio between the y-axis and x-axis. A slope greater than one suggests an overestimation, whereas a slope less than one indicates an underestimation. The R² measures how well the data fit the standard curve and reflects its linearity. The linear regression equation for recombinant plasmid was y = 1.0082x – 1.6091, with R² = 0.9975. A slope close to 1 (1.0082) indicated an almost perfect match between the expected and measured values. The highest R² values among the three templates indicated superior precision. These findings indicate that recombinant plasmids provide the most accurate and precise PCR templates, which is consistent with previous studies demonstrating that recombinant plasmid calibration curves offer higher sensitivity, a broader linear dynamic range, and greater reproducibility over time.
Multiple regression analysis was performed to examine the bacterial characteristics that influenced highthroughput sequencing bias. The results showed that the %GC content of the target gene region (p = 0.013) and 16S rRNA gene copy number (p = 0.005) were the most significant factors affecting NGS output. Genome size showed a weak correlation (p = 0.112), and Gram staining was not statistically significant (p = 0.997). These findings suggest that PCR amplification during library preparation plays a crucial role in introducing bias. Based on our multiple regression model, we developed a formula that can partially compensate for output variations in 16S rRNA gene-targeted NGS. The model demonstrated an R² value of 0.650 (adjusted R² = 0.542), indicating that approximately 65.0% of the variability in NGS output could be explained by these factors. However, as this model does not account for all potential biases, further optimization is required to improve its predictive accuracy. Several previous studies have attempted to normalize NGS bias by adjusting the 16S rRNA gene copy number of each bacterium [17,18]. However, our model incorporates additional factors such as genome size and %GC content, providing a more comprehensive approach. In particular, the GC content of the target region appeared to be a key factor affecting PCR efficiency, which is consistent with previous research [19].
This study investigated the factors that cause bias during 16S rRNA-targeted NGS for microbiome analysis using three different mock communities by amplifying the V3V4 region of the 16S rRNA gene. Further refinement and validation should be conducted using a larger number of mock samples to enhance the accuracy and reliability of the proposed formula. Further research is required to comprehensively evaluate the explanatory power of the formula and assess the bias between the predicted and actual proportions.
To better assess the processing of the initial sample during the DNA extraction steps, additional tests on mock communities are required. Although several studies have investigated the effects of DNA purification methods [7,20], mock communities composed of even quantities of bacterial cells do not accurately represent microbial composition. Artificial specimens can play a significant role in mimicking clinical samples, and mock communities formed with such artifacts can help evaluate and control the quality of the entire highthroughput sequencing process.
This study was exempt from informed consent as it did not involve human subjects or human-derived materials. The research was conducted using only laboratory strains of microorganisms and did not require handling of any patient samples or personal data. This exemption was formally confirmed by the Institutional Review Board (IRB) of Severance Hospital, Yonsei University College of Medicine prior to the commencement of the study (4-2016-0388).
Dongeun Yong was an editorial board member of the Annals of Clinical Microbiology until 2024. However, he was not involved in the review process of this article. No other potential conflicts of interest relevant to this article were reported.
This research was supported by the Bio and Medical Technology Development Program of the National Research Foundation (NRF), funded by the Korean government (MSIT) (No. RS-2023-00219213), a National Research Foundation (NRF) grant funded by the Ministry of Science and ICT (MSIT) of Korea (2022K1A4A8A01080317), and a grant from the Korea Health Technology R&D Project through the Korea Health Industry Development Institute (KHIDI) funded by the Ministry of Health & Welfare, Republic of Korea (HI23C1216).
The datasets generated during the current study are available from the corresponding author upon request.
1. D’Amore R, Ijaz UZ, Schirmer M, Kenny JG, Gregory R, Darby AC, et al. A comprehensive benchmarking study of protocols and sequencing platforms for 16S rRNA community profiling. BMC Genomics 2016;17:1-20.


2. Tringe SG and Hugenholtz P. A renaissance for the pioneering 16S rRNA gene. Curr Opinion Microbiol 2008;11:442-6.
3. Hamady M and Knight R. Microbial community profiling for human microbiome projects: tools, techniques, and challenges. Genome Res 2009;19:1141-52.
4. Rinke C, Schwientek P, Sczyrba A, Ivanova NN, Anderson IJ, Cheng JF, et al. Insights into the phylogeny and coding potential of microbial dark matter. Nature 2013;499:431-7.
5. Barb JJ, Oler AJ, Kim HS, Chalmers N, Wallen GR, Cashion A, et al. Development of an analysis pipeline characterizing multiple hypervariable regions of 16S rRNA using mock samples. PloS One 2016;11:e0148047.
6. Liu Z, DeSantis TZ, Andersen GL, Knight R. Accurate taxonomy assignments from 16S rRNA sequences produced by highly parallel pyrosequencers. Nucleic Acids Res 2008;36:e120.
7. Willner D, Daly J, Whiley D, Grimwood K, Wainwright CE, Hugenholtz P. Comparison of DNA extraction methods for microbial community profiling with an application to pediatric bronchoalveolar lavage samples. PloS One 2012;7:e34605.
8. Bowers RM, Clum A, Tice H, Lim J, Singh K, Ciobanu D, et al. Impact of library preparation protocols and template quantity on the metagenomic reconstruction of a mock microbial community. BMC Genomics 2015;16:1-12.
9. Clinical and Laboratory Standards Institute. Interpretive criteria for identification of bacteria and fungi by DNA target sequencing. MM18-A. Wayne, PA; CLSI: 2008.
10. Poretsky R, Rodriguez-R LM, Luo C, Tsementzi D, Konstantinidis KT. Strengths and limitations of 16S rRNA gene amplicon sequencing in revealing temporal microbial community dynamics. PloS One 2014;9:e93827.
11. Illumina. Illumina 16S metagenomic sequencing library preparation. https://support.illumina.com/documents/documentation/chemistry_documentation/16s/16s-metagenomic-library-prep-guide-15044223-b.pdf [Online] (last visited on 15 June 2018).
12. Quast C, Pruesse E, Yilmaz P, Gerken J, Schweer T, Yarza P, et al. The SILVA ribosomal RNA gene database project: improved data processing and web-based tools. Nucleic Acids Res 2012;41:D590-6.
13. Cole JR, Wang Q, Fish JA, Chai B, McGarrell DM, Sun Y, et al. Ribosomal Database Project: data and tools for high throughput rRNA analysis. Nucleic Acids Res 2014;42:D633-42.
14. Haas BJ, Gevers D, Earl AM, Feldgarden M, Ward DV, Giannoukos G, et al. Chimeric 16S rRNA sequence formation and detection in Sanger and 454-pyrosequenced PCR amplicons. Genome Res 2011;21:494-504.
15. Paliy O, Kenche H, Abernathy F, Michail S. High-throughput quantitative analysis of the human intestinal microbiota with a phylogenetic microarray. Appl Environ Microbiol 2009;75:3572-9.
16. Lauder AP, Roche AM, Sherrill-Mix S, Bailey A, Laughlin AL, Bittinger K, et al. Comparison of placenta samples with contamination controls does not provide evidence for a distinct placenta microbiota. Microbiome 2016;4:1-11.
17. Andersson AF, Lindberg M, Jakobsson H, Bäckhed F, Nyrén P, Engstrand L. Comparative analysis of human gut microbiota by barcoded pyrosequencing. PloS One 2008;3:e2836.
18. Kozich JJ, Westcott SL, Baxter NT, Highlander SK, Schloss PD. Development of a dual-index sequencing strategy and curation pipeline for analyzing amplicon sequence data on the MiSeq Illumina sequencing platform. Appl Environ Microbiol 2013;79:5112-20.
19. Polz MF and Cavanaugh CM. Bias in template-to-product ratios in multitemplate PCR. Appl Environ Microbiol 1998;64:3724-30.
20. Fouhy F, Clooney AG, Stanton C, Claesson MJ, Cotter PD. 16S rRNA gene sequencing of mock microbial populations-impact of DNA extraction method, primer choice and sequencing platform. BMC Microbiol 2016;16:1-13.
1. D’Amore R, Ijaz UZ, Schirmer M, Kenny JG, Gregory R, Darby AC, et al. A comprehensive benchmarking study of protocols and sequencing platforms for 16S rRNA community profiling. BMC Genomics 2016;17:1-20.
2. Tringe SG and Hugenholtz P. A renaissance for the pioneering 16S rRNA gene. Curr Opinion Microbiol 2008;11:442-6.
3. Hamady M and Knight R. Microbial community profiling for human microbiome projects: tools, techniques, and challenges. Genome Res 2009;19:1141-52.
4. Rinke C, Schwientek P, Sczyrba A, Ivanova NN, Anderson IJ, Cheng JF, et al. Insights into the phylogeny and coding potential of microbial dark matter. Nature 2013;499:431-7.
5. Barb JJ, Oler AJ, Kim HS, Chalmers N, Wallen GR, Cashion A, et al. Development of an analysis pipeline characterizing multiple hypervariable regions of 16S rRNA using mock samples. PloS One 2016;11:e0148047.
6. Liu Z, DeSantis TZ, Andersen GL, Knight R. Accurate taxonomy assignments from 16S rRNA sequences produced by highly parallel pyrosequencers. Nucleic Acids Res 2008;36:e120.
7. Willner D, Daly J, Whiley D, Grimwood K, Wainwright CE, Hugenholtz P. Comparison of DNA extraction methods for microbial community profiling with an application to pediatric bronchoalveolar lavage samples. PloS One 2012;7:e34605.
8. Bowers RM, Clum A, Tice H, Lim J, Singh K, Ciobanu D, et al. Impact of library preparation protocols and template quantity on the metagenomic reconstruction of a mock microbial community. BMC Genomics 2015;16:1-12.
9. Clinical and Laboratory Standards Institute. Interpretive criteria for identification of bacteria and fungi by DNA target sequencing. MM18-A. Wayne, PA; CLSI: 2008.
10. Poretsky R, Rodriguez-R LM, Luo C, Tsementzi D, Konstantinidis KT. Strengths and limitations of 16S rRNA gene amplicon sequencing in revealing temporal microbial community dynamics. PloS One 2014;9:e93827.
11. Illumina. Illumina 16S metagenomic sequencing library preparation. https://support.illumina.com/documents/documentation/chemistry_documentation/16s/16s-metagenomic-library-prepguide-15044223-b.pdf [Online] (last visited on 15,06,2018).
12. Quast C, Pruesse E, Yilmaz P, Gerken J, Schweer T, Yarza P, et al. The SILVA ribosomal RNA gene database project: improved data processing and web-based tools. Nucleic Acids Res 2012;41:D590-6.
13. Cole JR, Wang Q, Fish JA, Chai B, McGarrell DM, Sun Y, et al. Ribosomal Database Project: data and tools for high throughput rRNA analysis. Nucleic Acids Res 2014;42:D633-42.
14. Haas BJ, Gevers D, Earl AM, Feldgarden M, Ward DV, Giannoukos G, et al. Chimeric 16S rRNA sequence formation and detection in Sanger and 454-pyrosequenced PCR amplicons. Genome Res 2011;21:494-504.
15. Paliy O, Kenche H, Abernathy F, Michail S. High-throughput quantitative analysis of the human intestinal microbiota with a phylogenetic microarray. Appl Environ Microbiol 2009;75:3572-9.
16. Lauder AP, Roche AM, Sherrill-Mix S, Bailey A, Laughlin AL, Bittinger K, et al. Comparison of placenta samples with contamination controls does not provide evidence for a distinct placenta microbiota. Microbiome 2016;4:1-11.
17. Andersson AF, Lindberg M, Jakobsson H, Bäckhed F, Nyrén P, Engstrand L. Comparative analysis of human gut microbiota by barcoded pyrosequencing. PloS One 2008;3:e2836.
18. Kozich JJ, Westcott SL, Baxter NT, Highlander SK, Schloss PD. Development of a dual-index sequencing strategy and curation pipeline for analyzing amplicon sequence data on the MiSeq Illumina sequencing platform. Appl Environ Microbiol 2013;79:5112-20.
19. Polz MF and Cavanaugh CM. Bias in template-to-product ratios in multitemplate PCR. Appl Environ Microbiol 1998;64:3724-30.
20. Fouhy F, Clooney AG, Stanton C, Claesson MJ, Cotter PD. 16S rRNA gene sequencing of mock microbial populations-impact of DNA extraction method, primer choice and sequencing platform. BMC Microbiol 2016;16:1-13.