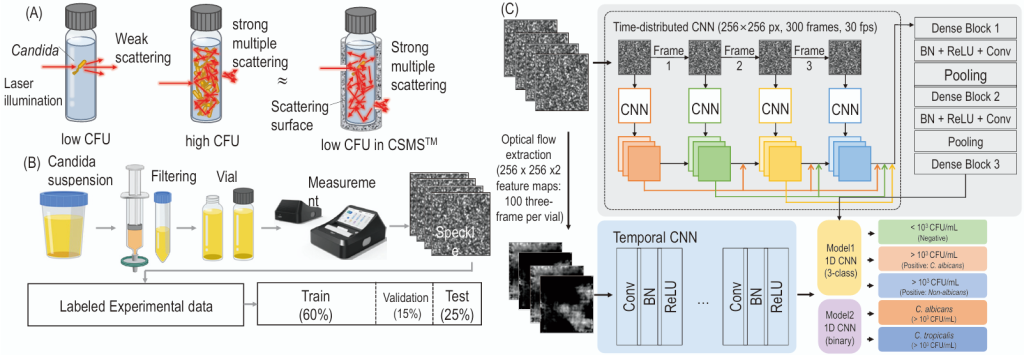
Fig. 1. Schematic of the laser scattering signal amplification (LSSA) platform and two-stream convolutional neural network (CNN) architecture for vulvovaginal candidiasis classification. (A) LSSA signal amplification principle. At low fungal cell concentration, incident light undergoes weak scattering through the sample vial. At high fungal cell concentration, the same light undergoes strong multiple scattering. The Bacometer’s scattering chamber (CSMS™) provides an amplification surface so that even samples with low fungal cell counts produce strong multiple scattering equivalent to samples with high fungal cell counts without the chamber. (B) Clinical specimen measurement workflow. Vaginal discharge specimens are filtered through a 0.45-µm membrane filter; the filtrate is transferred to a glass vial, serially diluted (undiluted, 1:10, 1:100, 1:1000), and inserted into the Bacometer (The Wavetalk Co., Ltd.). The Bacometer captures 300 consecutive speckle images (256 × 256 pixels) over a 10-s window at 30 fps following 30 min thermal stabilization at 30°C. (C) Two-stage deep-learning classifier. Speckle image sequences are converted into 2-channel optical-flow feature maps (256×256×2; 100 three-frame chunks per vial) and processed by a two-stream CNN: a time-distributed spatial DenseNet (Dense Blocks 1–3, each followed by batch normalization [BN]+ReLU+Conv+Pooling) and a temporal DenseNet-based 1D CNN (Conv-BN-ReLU layers with global average pooling). Concatenated features are classified by Model 1 (3-class: Negative / Positive C. albicans / Positive Non-albicans) and, for Positive samples, by Model 2 (binary: C. albicans / C. tropicalis). Both models share the same network topology but were trained on entirely non-overlapping datasets (Model 1: 320 vials; Model 2: 80 vials). Layer-by-layer architecture specifications are provided in Supplementary Methods. CFU, colony-forming units.
Ann Clin Microbiol 2025;29(2):9. Laser scattering signal amplification and deep learning for detection of Candida culture positivity in women with vaginal symptoms: a preliminary analytical and pilot clinical evaluation Download image
Table 2. Class-specific performance of the two-stage LSSA classifier on hold-out reference-strain test sets (exact Clopper–Pearson 95% CI)
Ann Clin Microbiol 2025;29(2):9. Laser scattering signal amplification and deep learning for detection of Candida culture positivity in women with vaginal symptoms: a preliminary analytical and pilot clinical evaluation Download table Model Class Sensitivity (95% CI) Specificity (95% CI) PPV (95% CI) NPV (95% CI) F1 score 1a) Negative (<103 CFU/mL) 85.0% (70.2–94.3%) 90.0% (76.3–97.2%) 89.5% […]
Table 1. Summary of patient characteristics and pilot clinical evaluation results (n = 20)
Ann Clin Microbiol 2025;29(2):9. Laser scattering signal amplification and deep learning for detection of Candida culture positivity in women with vaginal symptoms: a preliminary analytical and pilot clinical evaluation Download table Characteristic Value Age, years — median (IQR) 49.5 (44–55); range 29–63 Premenopausal 13 (65.0%) Postmenopausal 6 (30.0%) Unknown menopausal statusa) 1 (5.0%) Diabetes mellitus […]
Table 1. Characteristics of two azithromycin-resistant Neisseria gonorrhoeae isolates
Ann Clin Microbiol 2025;29(2):8. Whole-genome characterization of two azithromycin-resistant Neisseria gonorrhoeae ST1600 isolates from Busan, South Korea Download table Characteristics Year of isolation 2018 2019 Area of isolation (city) Busan Busan Antimicrobial susceptibility (MIC (µg/mL) and interpretation) Azithromycin 32, R 32, R Ciprofloxacin 32, R 16, R Spectinomycin 32, S 16, S Tetracycline 2, R […]
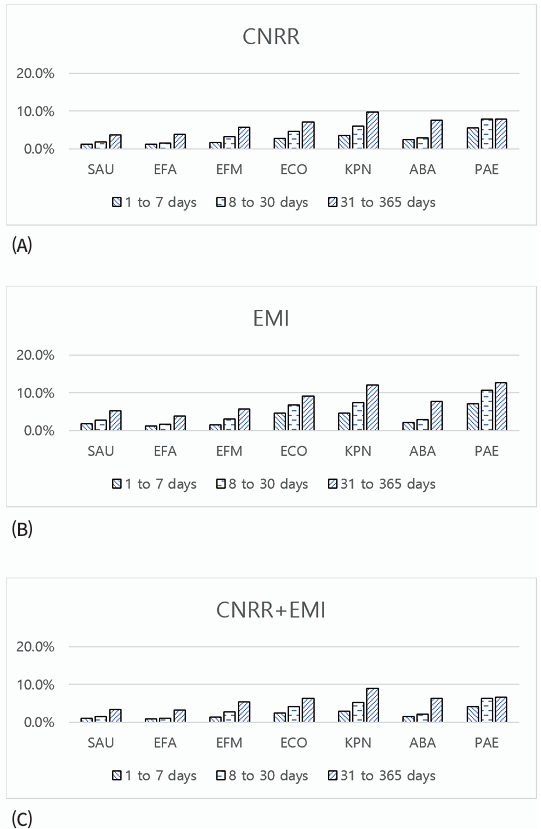
Fig. 1. Proportion (%) of the (A) CNRR, (B) EMI, and (C) CNRR+EMI rates of the tested antibiotics for “successive” isolates (a successive isolate comprises two microorganisms with the same species identification obtained at two different time points from the same patient). CNRR, change from nonresistant to resistant; EMI, essential MIC increase; SAU, Staphylococcus aureus; EFA, Enterococcus faecalis; EFM, Enterococcus faecium; ECO, Escherichia coli; KPN, Klebsiella pneumoniae; ABA, Acinetobacter baumannii complex; PAE, Pseudomonas aeruginosa.
Ann Clin Microbiol 2025;29(2):7. Evaluating the adequacy of intervals for repeat antimicrobial susceptibility testing Download image
Table 3. Proportion (%) of “successive” isolates with categorical change from nonresistant to resistant when the MIC change leading to this category change was >1 doubling dilution (CNRR + EMI) specified for each antibiotic a) b)
Ann Clin Microbiol 2025;29(2):7. Evaluating the adequacy of intervals for repeat antimicrobial susceptibility testing Download table Microorganism(no. of tested antibiotics) Antibiotics No. of days between isolates 1 2 3 4 5 6 7 A. baumannii(n= 47,274) Ampicillin-sulbactam 2.0 (0.4, 3.5) 0.3 (0.0, 0.8) 0.9 (0.1, 1.8) 1.6 (0.0, 3.2) 2.0 (0.1, 4.0) 2.2 (0.7, 3.8) […]
Table 2. Essential and categorical agreement for specific antimicrobials tested against paired Pseudomonas aeruginosa isolates from the same patient on the same day (n = 17,339)
Ann Clin Microbiol 2025;29(2):7. Evaluating the adequacy of intervals for repeat antimicrobial susceptibility testing Download table Antimicrobials Essential agreement, % (95% CI)a) Categorical agreement, % (95% CI)b) Amikacin 68.3 (65.9, 70.7) 79.0 (76.9, 81.1) Aztreonam 64.0 (61.6, 66.4) 54.3 (51.9, 56.7) Ceftazidime 59.6 (57.2, 62.0) 55.8 (53.4, 58.2) Ciprofloxacin 82.6 (80.5, 84.7) 75.2 (72.8, 77.6) […]
Table 1. Essential and categorical agreement of antimicrobial susceptibility test results for paired isolates from the same patient on the same day
Ann Clin Microbiol 2025;29(2):7. Evaluating the adequacy of intervals for repeat antimicrobial susceptibility testing Download table Species (No. of antimicrobials; No. of isolates) Essential agreement, % (95% CI)a) Categorical agreement, % (95% CI)b) Staphylococcus aureus (17; 7,537) 96.8 (96.4, 97.2) 97.4 (97.0, 97.8) Enterococcus faecalis (10; 1,537) 97.0 (96.2, 97.8) 96.4 (95.4, 97.4) Enterococcus faecium (11; 2,706) 93.7 […]
Evaluating the adequacy of intervals for repeat antimicrobial susceptibility testing
Original article Yu Jin Park1, Xinyi Lu2, Sunghyuk Kim1, Shinyoung Yoon1, Daewon Kim3, Ki Ho Hong1, Hyukmin Lee1, Dongeun Yong1,4 1Department of Laboratory Medicine and Research Institute of Bacterial Resistance, Yonsei University College of Medicine, Seoul, Korea2Graduate School of Medicine, Yonsei University College of Medicine, Seoul, Korea3Department of Laboratory Medicine, Gachon University Gil Medical Center, […]
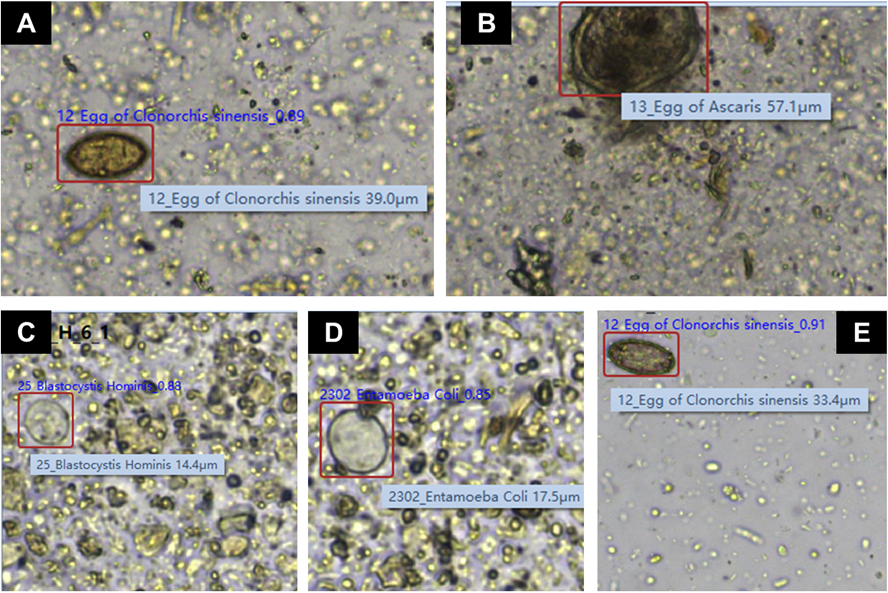
Fig. 1. Representative images, captured by the KU-F40 system, of the organisms identified differently by the FECT system. (A) Metagonimus yokogawai (FECT) vs. Clonorchis sinensis (KU-F40); (B) Trichuris trichiura (FECT) vs. Ascaris lumbricoides (KU-F40); (C) Entamoeba histolytica (FECT) vs. Blastocystis hominis (KU-F40); (D) Entamoeba histolytica (FECT) vs. Entamoeba coli (KU-F40); (E) Not detected (FECT) vs. Clonorchis sinensis (KU-F40). Images (A), (B), and (E) were captured using a 20× objective lens, while images (C) and (D) were captured using a 40× objective lens. FECT, formalin–ether concentration technique.
Ann Clin Microbiol 2025;29(2):6. Performance of an AI-based automated feces analyzer compared with the formalin-ether concentration technique for intestinal parasite detection: a diagnostic accuracy study Download image